
Overview:
- The technology & telecommunications industry ranks fourth in our 2021 Brand Intimacy COVID Study. To review our new study, click here.
- Apple is the top-ranking brand in the industry and in the study. To review its profile, click here.
- Notably, Samsung has improved its quotient score by 7 percent, the largest gain of any brand in the category. To view its results, click here.
Introduction
We shared our 2020 Brand Intimacy COVID Study last year as the pandemic was affecting all our lives. We were interested in seeing its impact on the brands we all use and love. We are now sharing a follow-up study, fielded a year later when things were improving and businesses began reopening. Lately, with the rise of the Delta variant, we see the extended presence of COVID in our lives. As the world continues to deal with the pandemic, and businesses and their brands face persistent challenges, we are sharing new insights on how brands can focus, enhance, or optimize for the marketplace that we are all eager to see return to normal.
The findings from our follow-up Brand Intimacy COVID Study, conducted with 3,000 consumers in summer 2021, demonstrate how leading brand and consumer behavior has changed since a year ago.
Brand Intimacy Performance Today
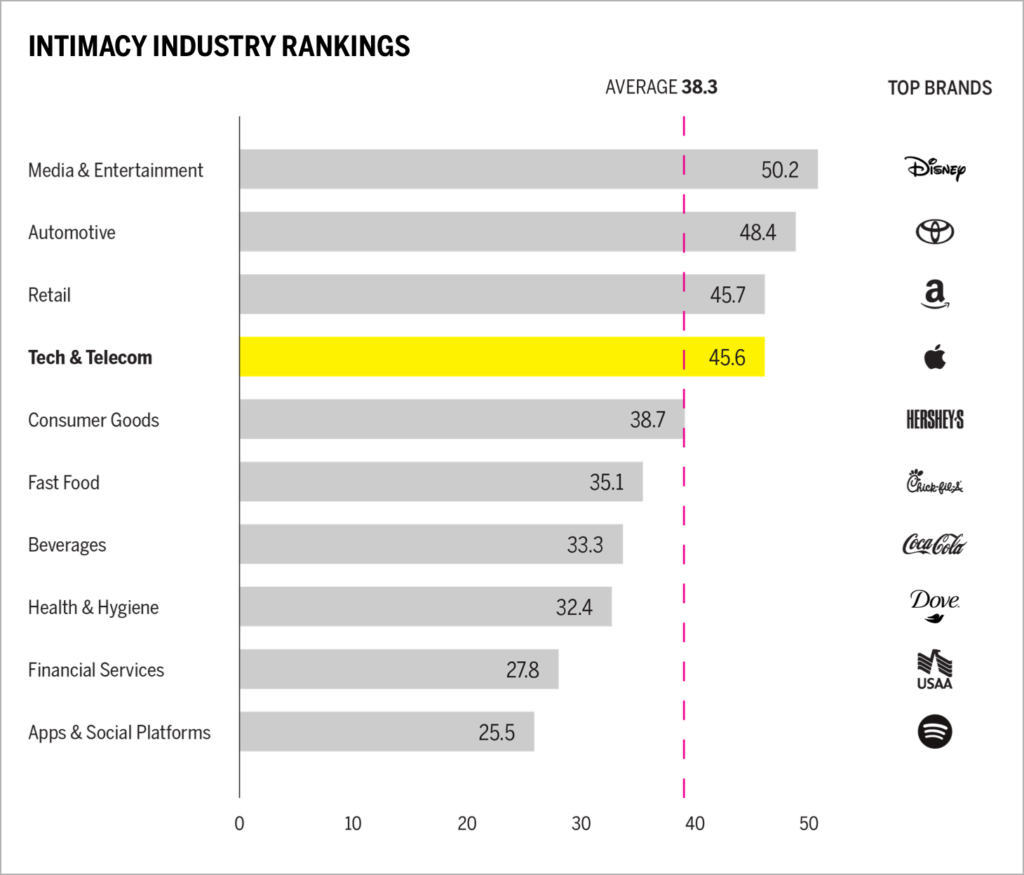
The technology & telecommunications industry ranks fourth this year, the same position it held in our 2020 COVID study. The industry has an average Brand Intimacy Quotient of 45.6, well above the cross-industry average of 38.3.
The pandemic continues to accelerate technology-driven evolutions in business, home life, and education, despite supply chain disruptions and uncertain use cases for emerging technologies such as 5G.1,2 More than 106 million new 5G smartphones are expected to ship in 2021, marking a 404 percent increase in revenue over the previous year, and overall tech industry retail sales are predicted to reach $487 billion.3
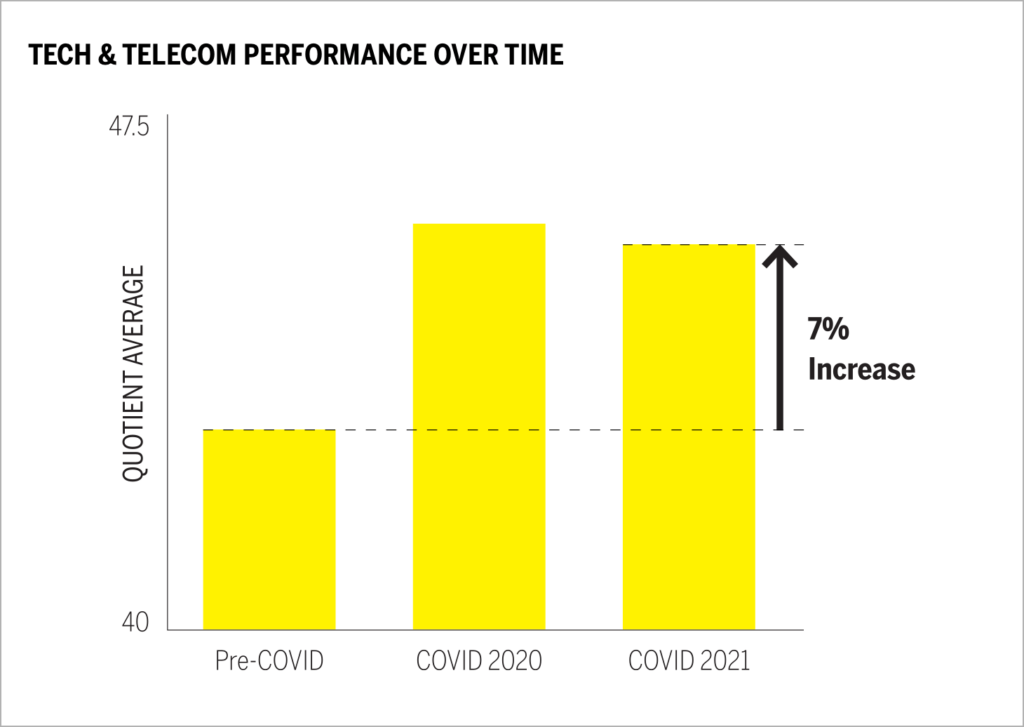
Despite supply chain disruptions and an uncertain market, Brand Intimacy performance for the industry has increased by an average of 7 percent since before the pandemic. Although COVID imposed hardships on people and businesses, this period has actually drawn consumers closer to brands and created stronger emotional relationships.
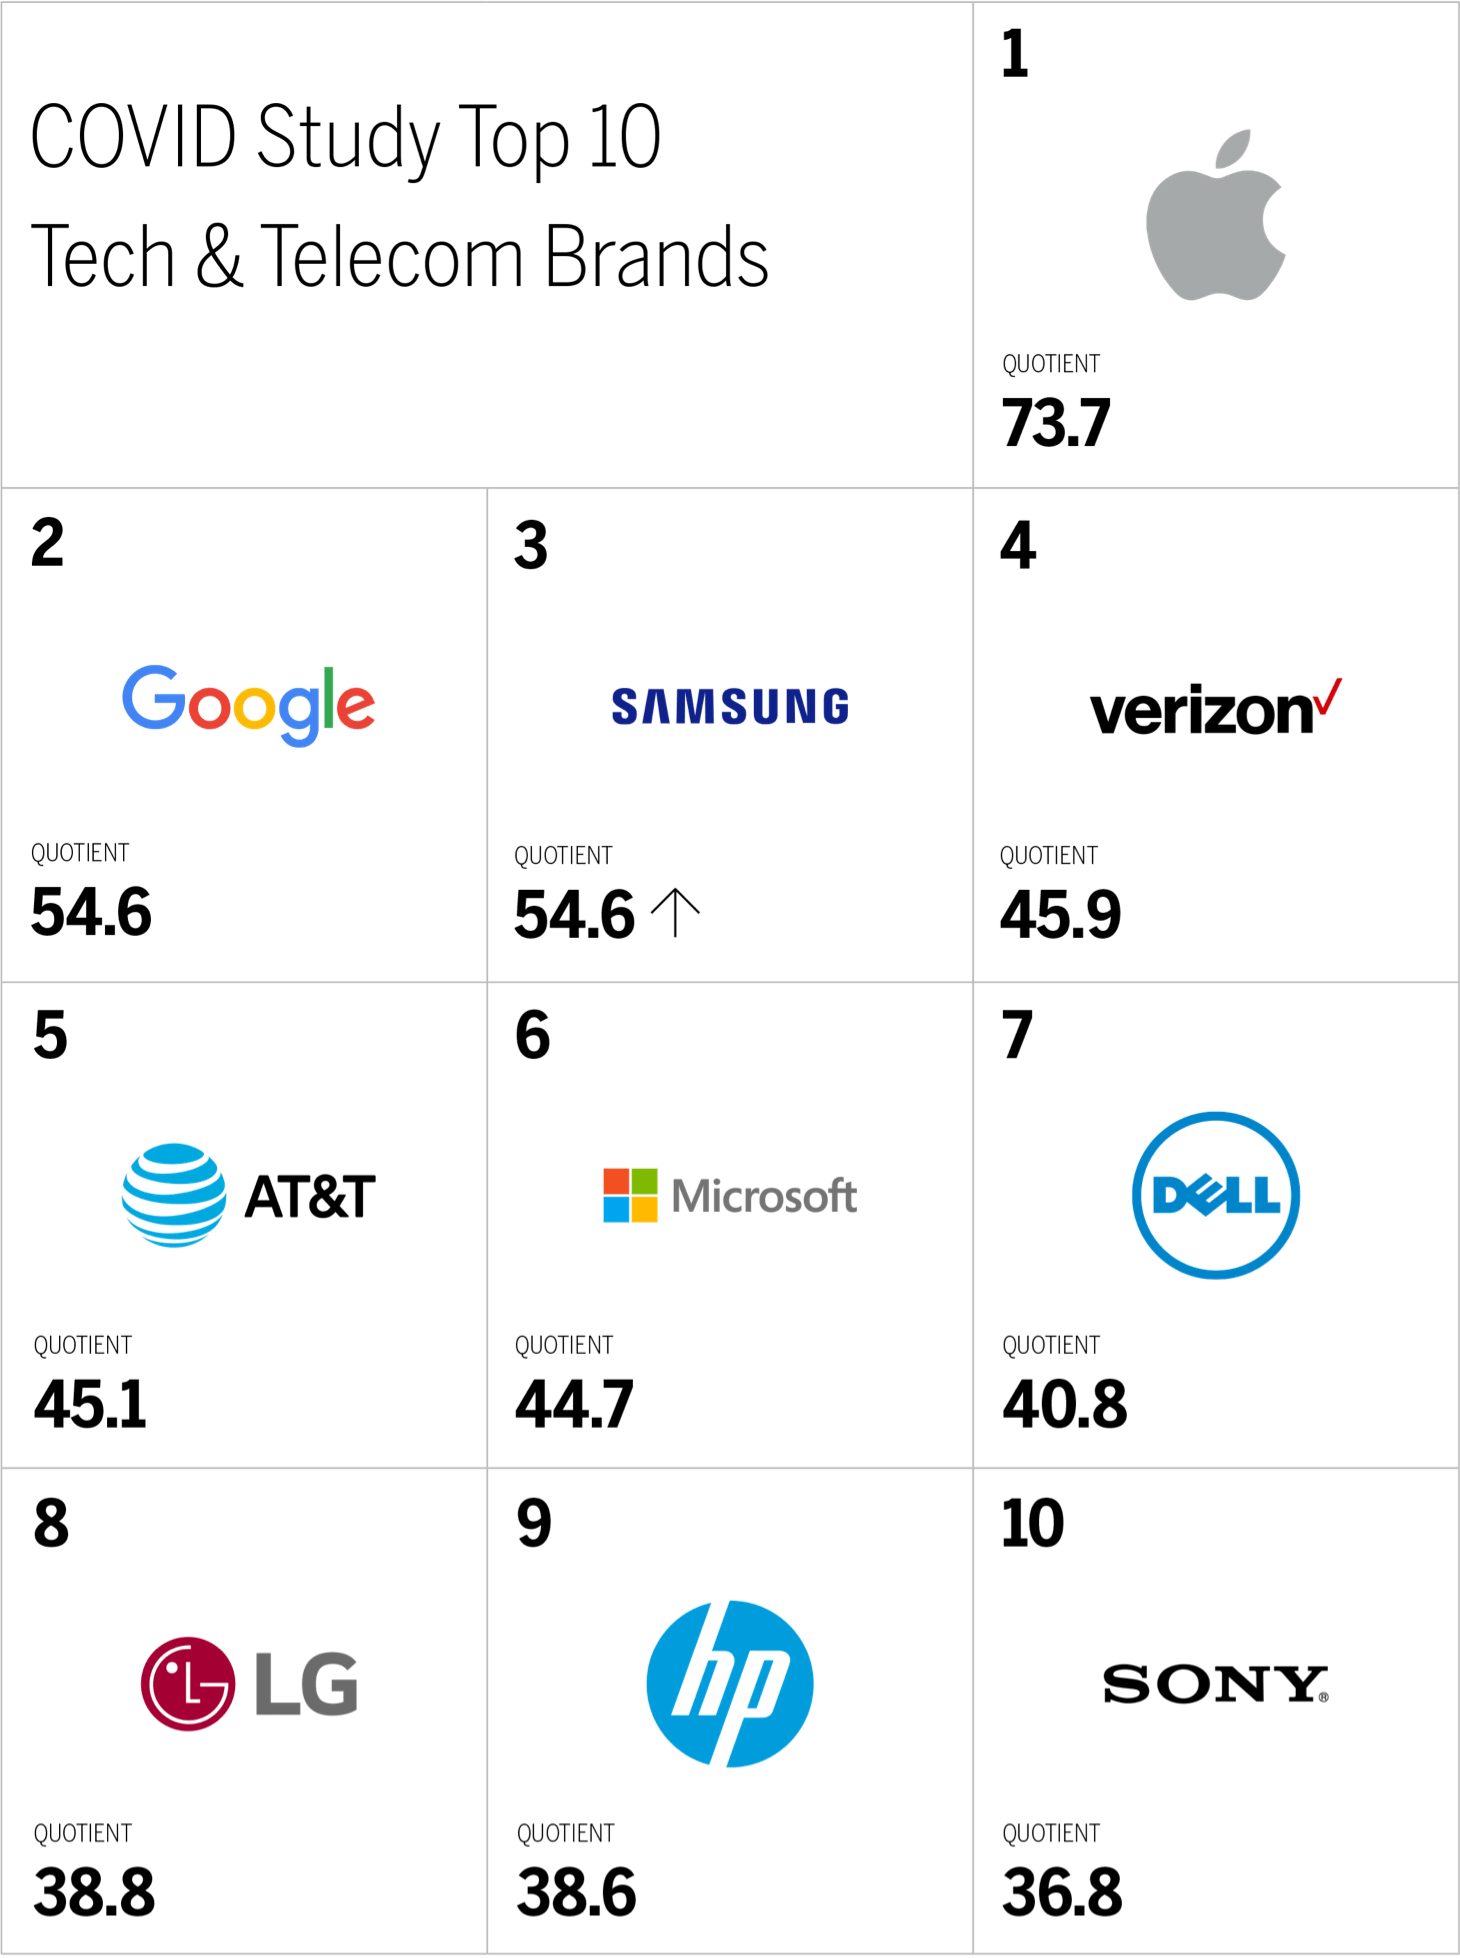
The top 10 technology & telecommunications brands have maintained their exact positions since our 2020 study, indicating that brands have been able to maintain their standings despite a trying year. Apple remains in first place, with Google in second place.
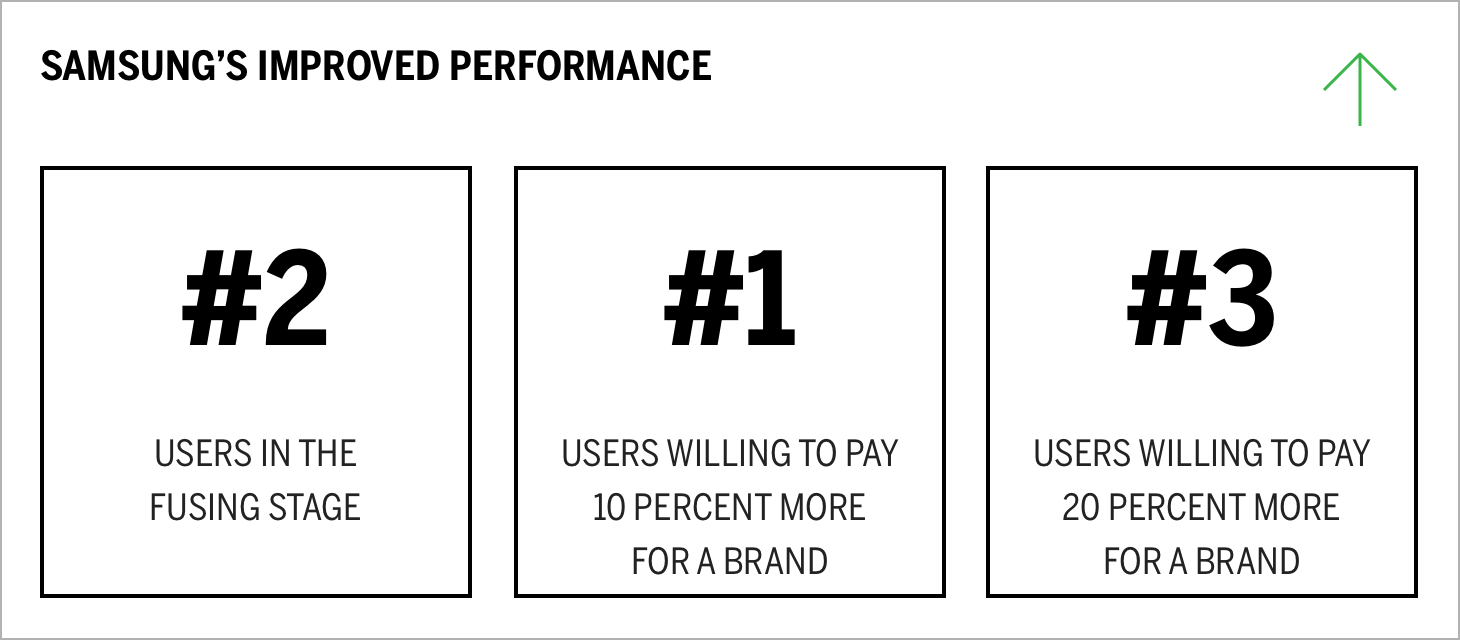
Samsung’s improved Quotient Score is the largest gain of any brand in the category, having risen by 7 percent since our 2020 COVID study. Samsung also increased its bonding score, the middle stage of intimacy, by 37 percent and its fusing score, the most advanced stage of Brand Intimacy, by 4 percent. The brand’s ritual archetype performance rose by 5 percent, suggesting that it is becoming more ingrained into customers’ lives. These increases mirror the brand’s marked earnings growth, a 20 percent increase in revenue and a 54 percent increase in operating profits year-on-year, a large part of which is attributed to its semiconductor business.4
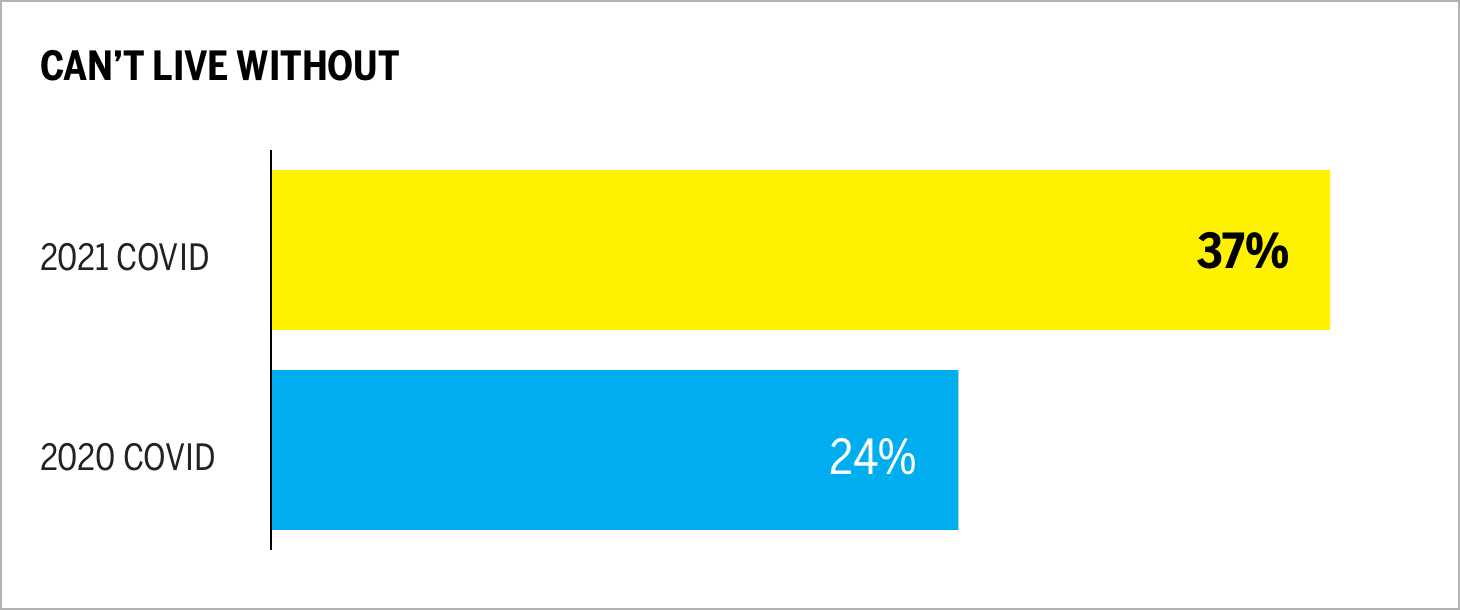
Can’t live without (a measure based on a ten-point scale that determines how essential a brand is to our lives) has increased during the pandemic by 59 percent, further highlighting consumers’ increasing reliance on technology and telecommunications brands.
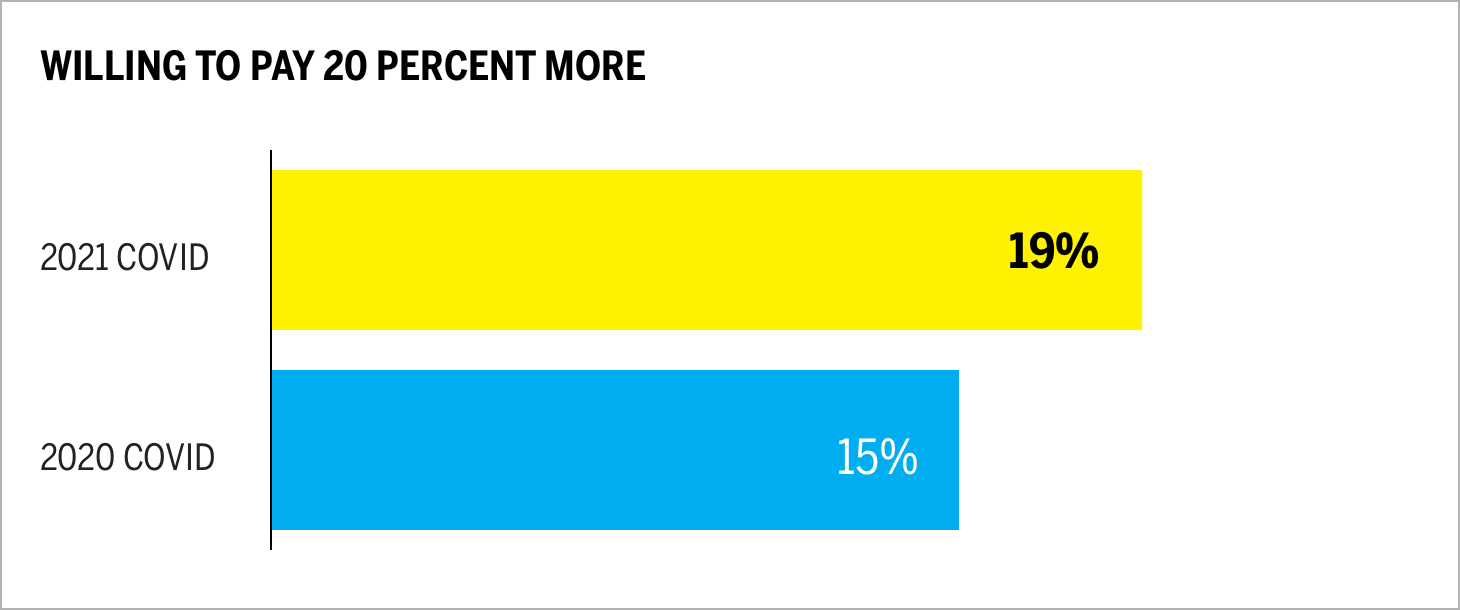
The percentage of technology and telecommunications consumers willing to pay 20 percent or more for brands’ products and services increased by 26 percent. Apple is the highest-ranked category brand for this measure, at 29 percent.
How Brands Speak
In addition to our Brand Intimacy findings, which center on how consumers feel about their brand relationships, we are also looking at how brands themselves have behaved and communicated since the pandemic started last year. What has changed in their messaging in a year? We’ve captured language analysis from company websites and outbound social media, and compared this to how brands were communicating last year, focusing on four brands and encompassing over 1,897,464 words.
This chart presents a comparison of how four leading brands are communicating about COVID on their websites. We are able to see the number of appearances of key themes for each brand and the relative differences based on the other themes reviewed (e.g., Google speaks about protection from misinformation 21.2 times more than other brands).
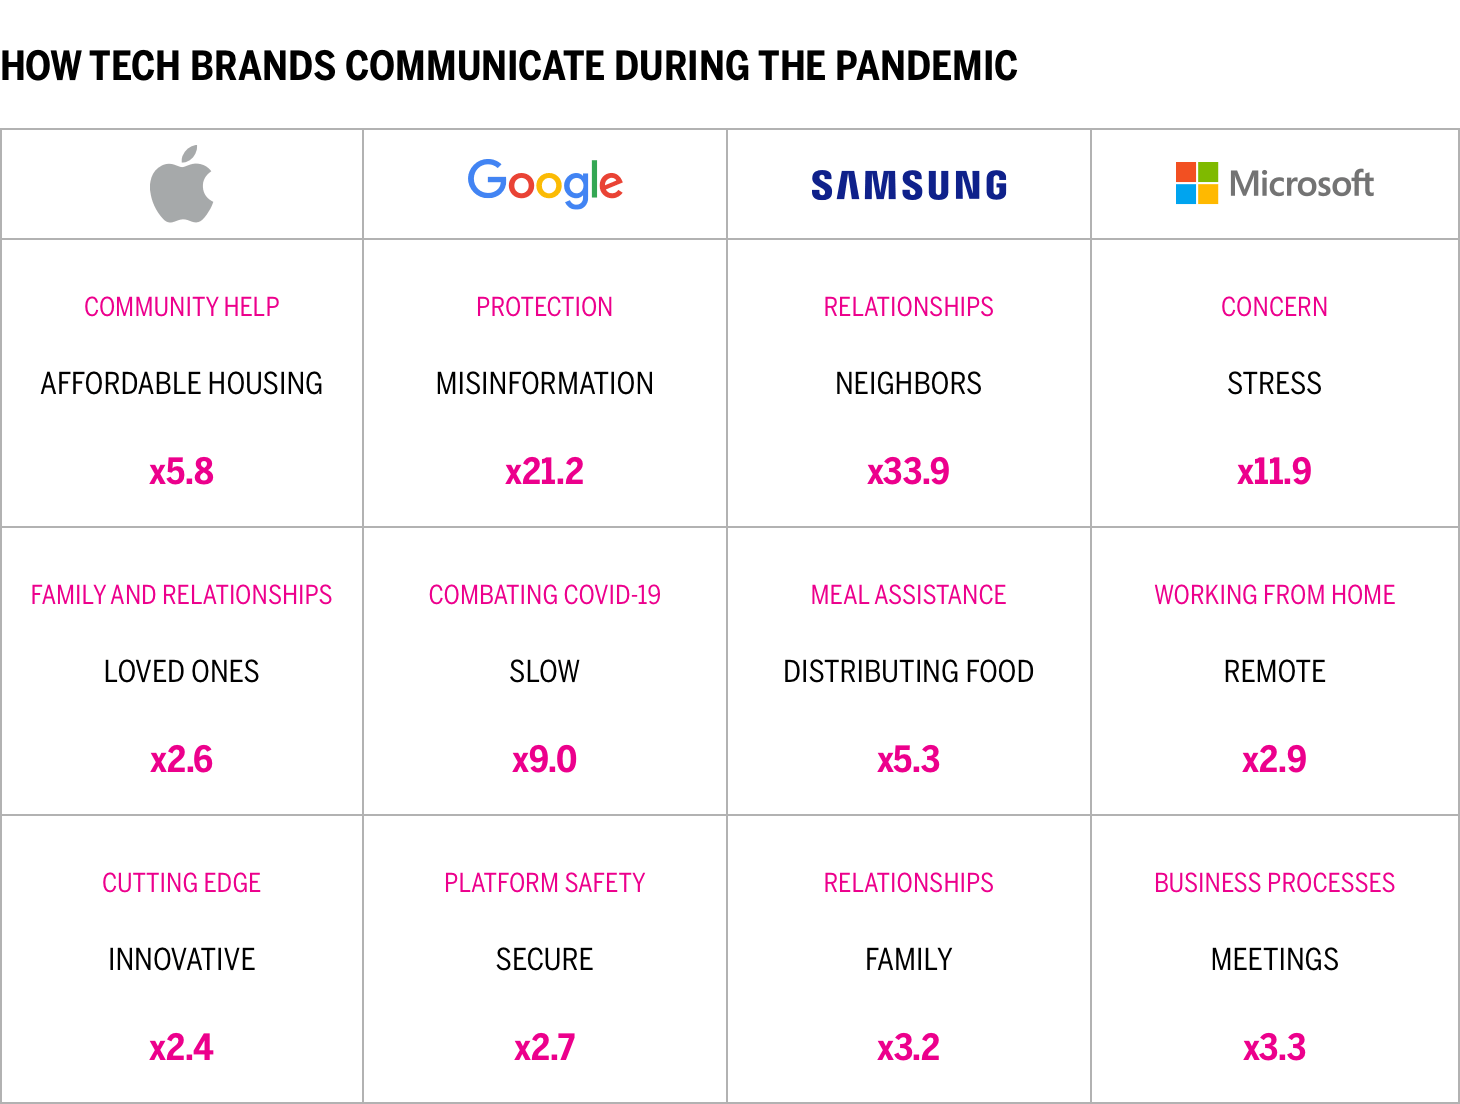
Technology & telecommunications brands show similarities in the ways in which they address the pandemic, with common themes of using technology to connect with people and improve work and life interactions. These topics are to be expected, and underline a shared focus on re-emphasizing the crucial role of the category in an evolving communications landscape. Microsoft, beyond speaking about the stresses induced by the current climate, speaks more about the role of its products in facilitating workplace processes and remote interactions. Apple and Samsung mention their roles in helping users connect with loved ones and neighbors, and how they help communities by facilitating affordable housing and meal distribution. Google places unique emphasis on combating misinformation, slowing the spread of the disease, and elevating platform security, highlighting its relevance in organizing and distributing information.
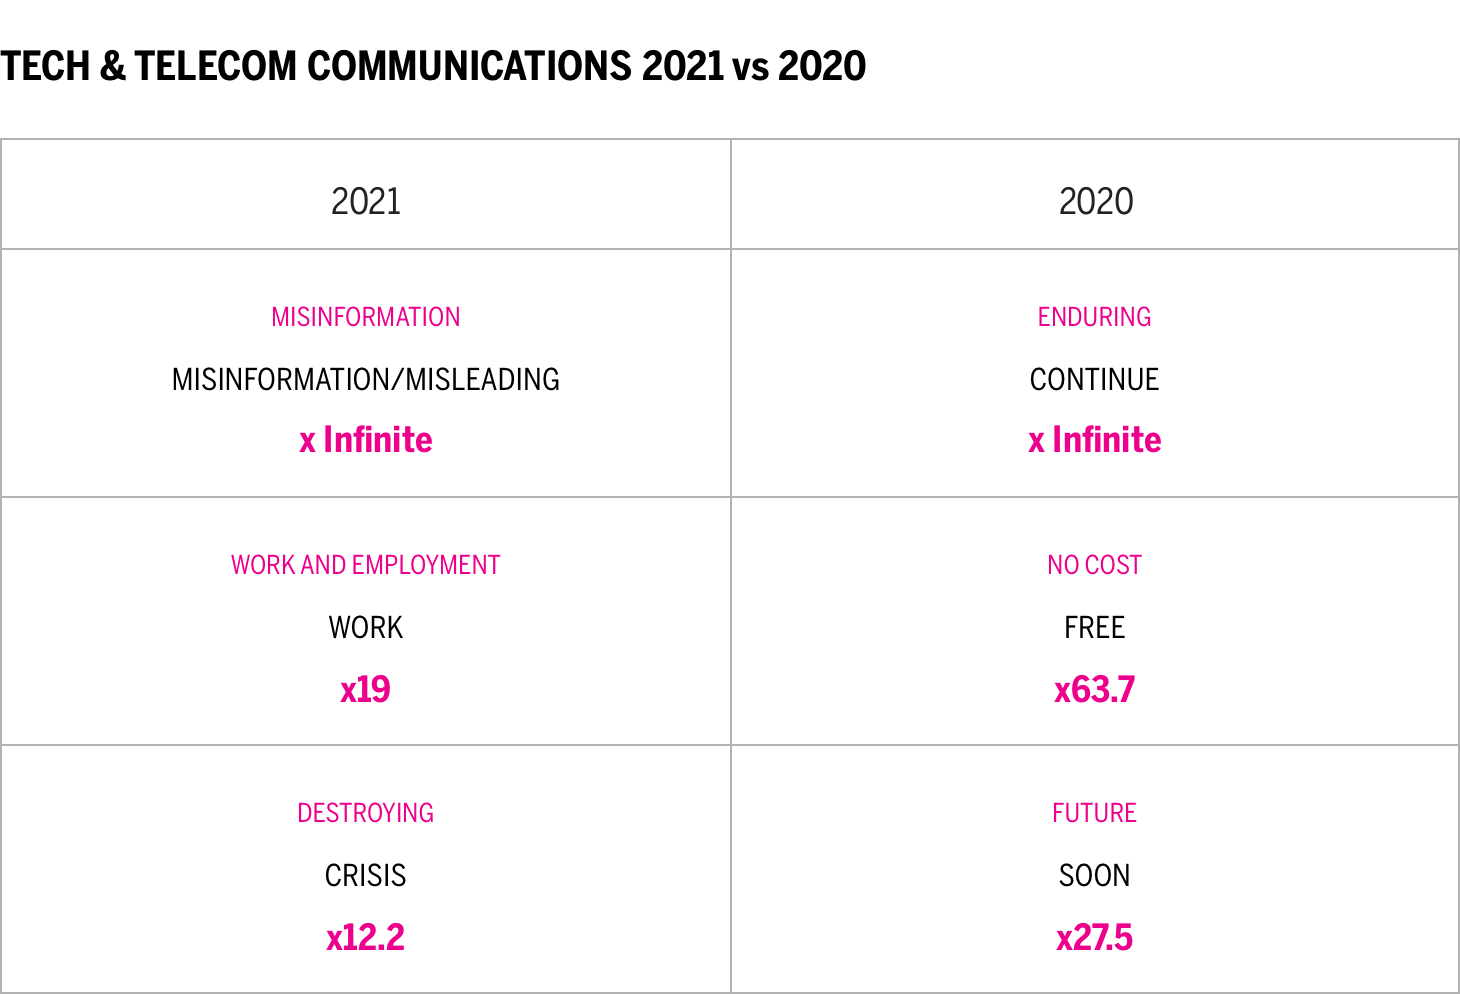
A year ago, communications from these brands were oriented around weathering the pandemic, speaking of how coming changes would improve the future, and describing tactical offerings that reduce costs, such as free deliveries. Messaging today is focused instead on addressing the crises caused by the pandemic, establishing new work policies and procedures, and protecting against misleading information. As the situation surrounding the pandemic has evolved, brands have shifted focus from reassuring customers towards describing how technology and telecommunications can effect change.
Conclusion
Our bonds with these brands remain strong today, but rankings within the industry have not changed and relationships have not strengthened. It appears that users are staying with their established relationships and that brand efforts to engage with users have largely maintained existing connections in the face of economic and industry challenges rather than deepening or creating new bonds.
All indications point to changes in digital interactions brought about by the pandemic becoming an integral part of how people live and work. As we slowly navigate out of this crisis, technology and telecommunications brands play an outsized role in affecting how the public interacts, perceives vaccinations and protective mandates, and comes together to rebuild and heal. This places the onus on brands to deepen their relationships with users, better leveraging the industry-dominant archetypes of enhancement (becoming smarter, more capable, and more connected through the use of the brand) and ritual (when a person ingrains a brand into his or her daily actions) to build stronger bonds and lasting emotional connections.
Read our detailed methodology here, and review the sources cited in this article here. Our Amazon best-selling book is available at all your favorite booksellers. Additionally, MBLM offers Custom Dashboards, providing extensive data for brands included in its annual Brand Intimacy Study. To learn more about our Agency, Lab, and Platform, visit mblm.com.