Foreseeing the Future
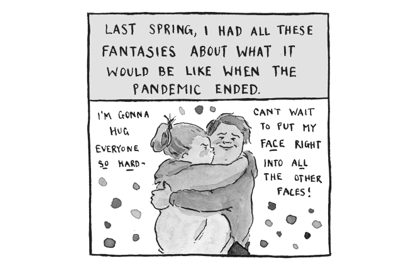
We anticipate that the cards reveal consumer behaviors that will continue to proliferate and evolve in 2024. The effects of the pandemic on how we live, work, and play has resulted in people appearing less social, seeking escape, acting more insular, and prioritizing their health.

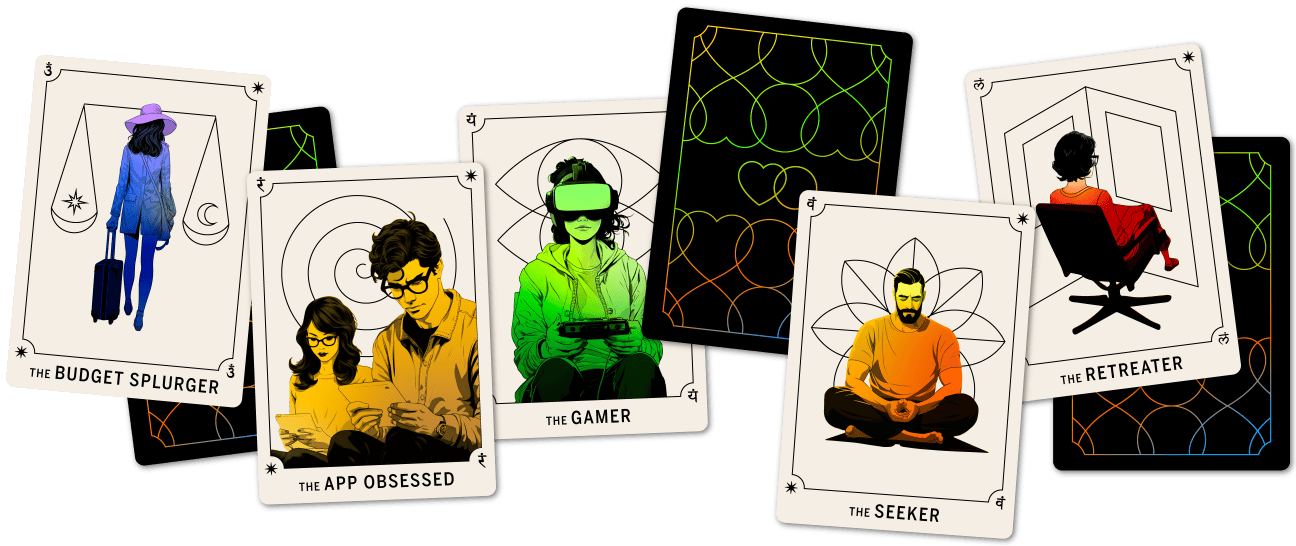
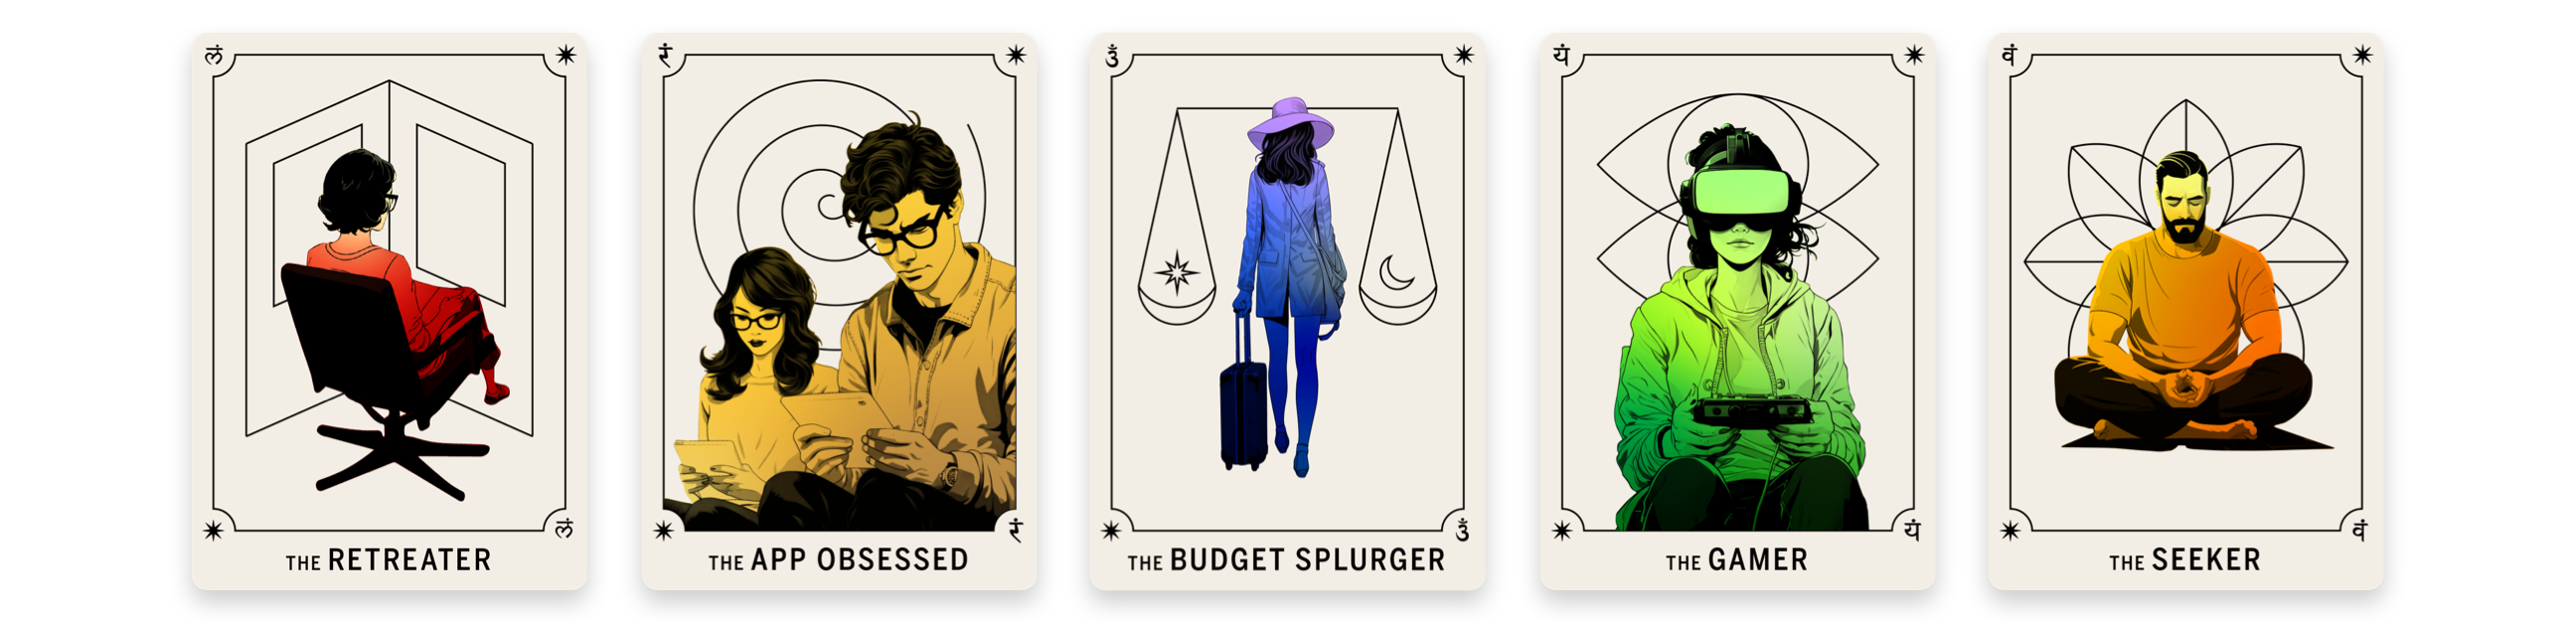
TREND #1

In today’s fast-paced and often overwhelming world, consumers are retreating to the safety and comfort of home. People are spending more time at home and want to remain at home even more.


Rising costs and behaviors adopted during the pandemic are two reasons why this trend is on the rise.

Quite simply, people want to be home more and travel less.

Particularly in urban areas, we also see a pervasive lack of civility and an increase in “bad behavior” post-pandemic that many seek to avoid. This, in concert with loneliness people have felt during the pandemic, has increased social awkwardness and made people withdraw.
This retreating, working, and eating more at home is reflected in our most recent Brand Intimacy Study. It highlights the rise of hybrid work and the decline of eating out.

People celebrate going home, relaxing, and being comfortable. This generally involves food, drink, and entertainment.


Retreaters are trying to maintain control over rising costs, their feelings of security, and the ability to socialize and entertain on their terms. As things change, it will be interesting to see how they evolve and if this trend splits into subsets like The Budget-Only Retreater, The Seasonal Retreater, or The Recluse.
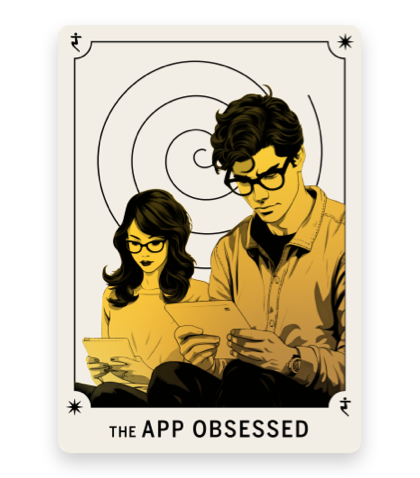
TREND #2

Apps are everywhere and ubiquitous, with consumers spending 5.5 hours per day on them. They span all categories and have become an essential part of our lives. Our reliance on apps suggests we continue to seek ease, convenience and gratification.


App use is pervasive, expansive, and growing. It is changing our behaviors and the way we live our lives.

The business of apps is growing and increasingly mobile.

Our review of the Smartphone Ecosystem over several years shows that although apps score lower than devices or content, their performance has improved by 24% since 2019.

This increasing reliance on apps is also reflected in our recent Brand Intimacy Study. The industry’s performance increased by 23%.


Apps continue to provide an increasingly broad array of options for today’s consumers, offering something for everyone. In addition to convenience and giving us activities at any given time, apps enable us to get smarter, meet people, meditate, take care of our health, update our banking, shop, and keep up.

TREND #3

Today, there is a pervasive shift toward saving money. However, a slight twist on this is the planning for splurges. This seemingly contradictory mentality of both spending and splurging simultaneously is becoming more common with today’s consumers.


At the core of this trend is being more cost-conscious in an uncertain economy.

Splurges are built into budgets and are pleasure-oriented experiences that center on things like dining and travel.

Our most recent Brand Intimacy Study revealed the archetype of indulgence has increased by 6% since our last study.


Both saving and splurging for today’s consumer are completely normal. Budgeting is trying to control when, how, and on what you spend your money, whereas splurges are planned permission to enjoy and treat yourself. They make it a little easier to keep saving.

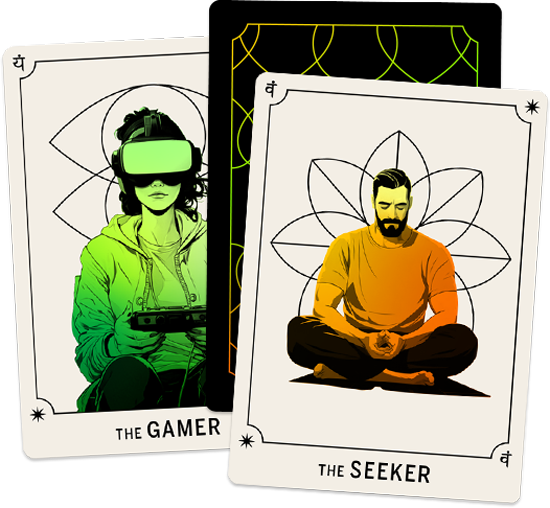
TREND #4

Gaming has become our favorite pastime. It’s gone beyond a children’s after-school activity into IP franchises. Today, gaming enables people to experience different realities and become someone new.


The industry is booming, demonstrating no signs of slowdown.

Gaming has broadened its appeal across both gender and age groups, and is becoming a leading form of entertainment.

Gaming provides value for money and lets people express themselves in new ways.

Gaming debuted in fifth position in our most recent Brand Intimacy Study. It ranked higher than Apparel and Sports Leagues. Gaming ranks second out of 19 industries across the Brand Intimacy archetypes of fulfillment, identity, nostalgia, and indulgence.


Gaming is escape and entertainment. It’s fun, can be done solo or in groups and transports people to somewhere else. It’s expanded into movies and the mainstream and is another way people identify themselves. Early on, theories suggested that if people lived more fulfilling lives, they would not have to rely on games. Now, most feel that gaming makes life more enjoyable.
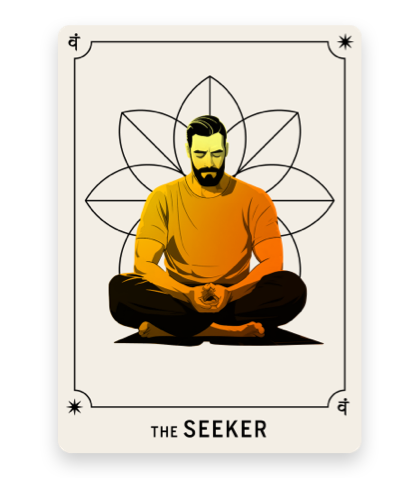
TREND #5

Wellness has been emerging from traditional healthcare, or beauty, and is becoming a powerful force on its own. Consumers are prioritizing their health, both mental and physical, more than ever before as the concept of wellness continues to expand.


Wellness is shifting from a luxury to an essential part of life.

Apps are one way people are focusing more on improving their health and quality of life.

People are expanding where and how they focus on wellness as well as what is considered wellness today.

Our most recent Brand Intimacy Study revealed the archetype of Indulgence, centered on pampering and self-gratification, increased by 6% in our most recent study. 13% The Health & Hygiene industry improved its performance by 13% in our most recent study.


People today are looking at their health more holistically and experimenting with different forms of wellness to find what works for them. From apps to alternative treatments, consumers are becoming more open and more committed to finding the right formula for optimizing their health.