
New Feature
2024 Trendcasts
Using our latest Brand Intimacy findings, we’ve forecasted 5 new behavioral profiles emerging among consumers today.
Brand Intimacy Study
The largest study of brands based on emotion
Our next-generation Brand Intimacy Study is our largest yet, using big data and artificial intelligence to rank and analyze over 600 of the world’s leading brands based on emotional connection.
Report
Review this year’s insights, top 10 most intimate brands, leading performers, breakout brands and industry overview.
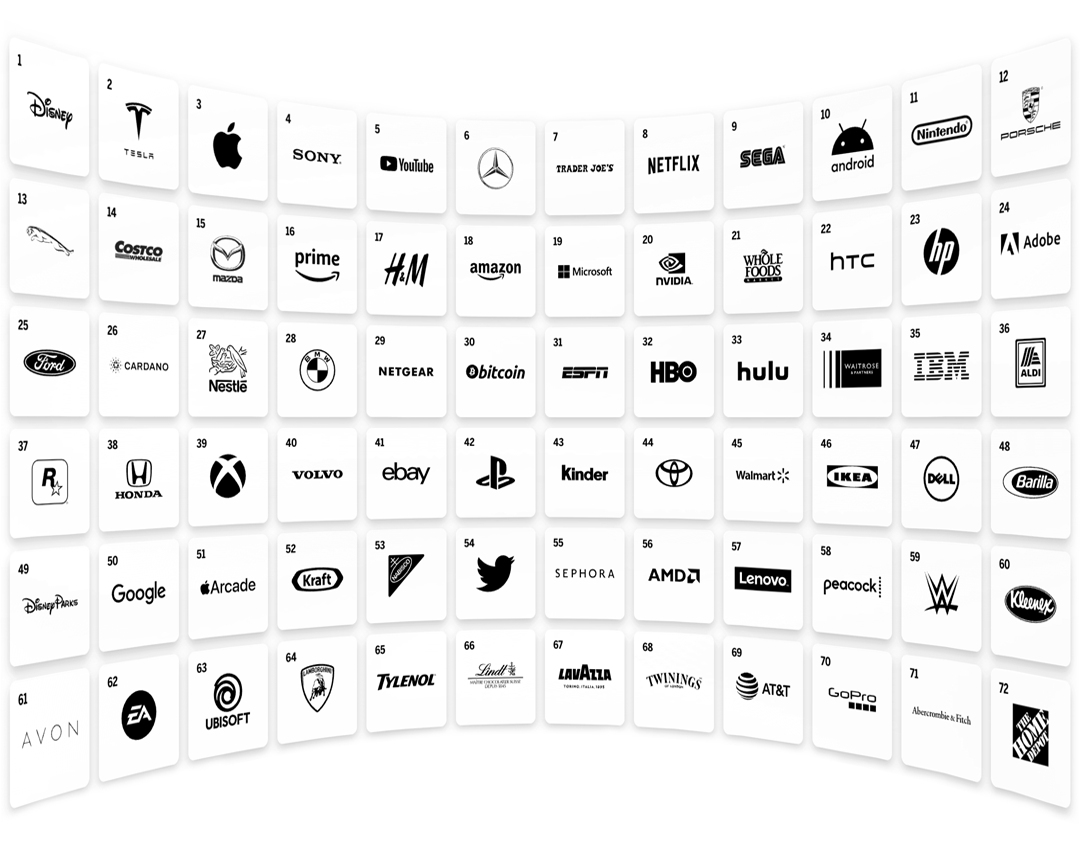
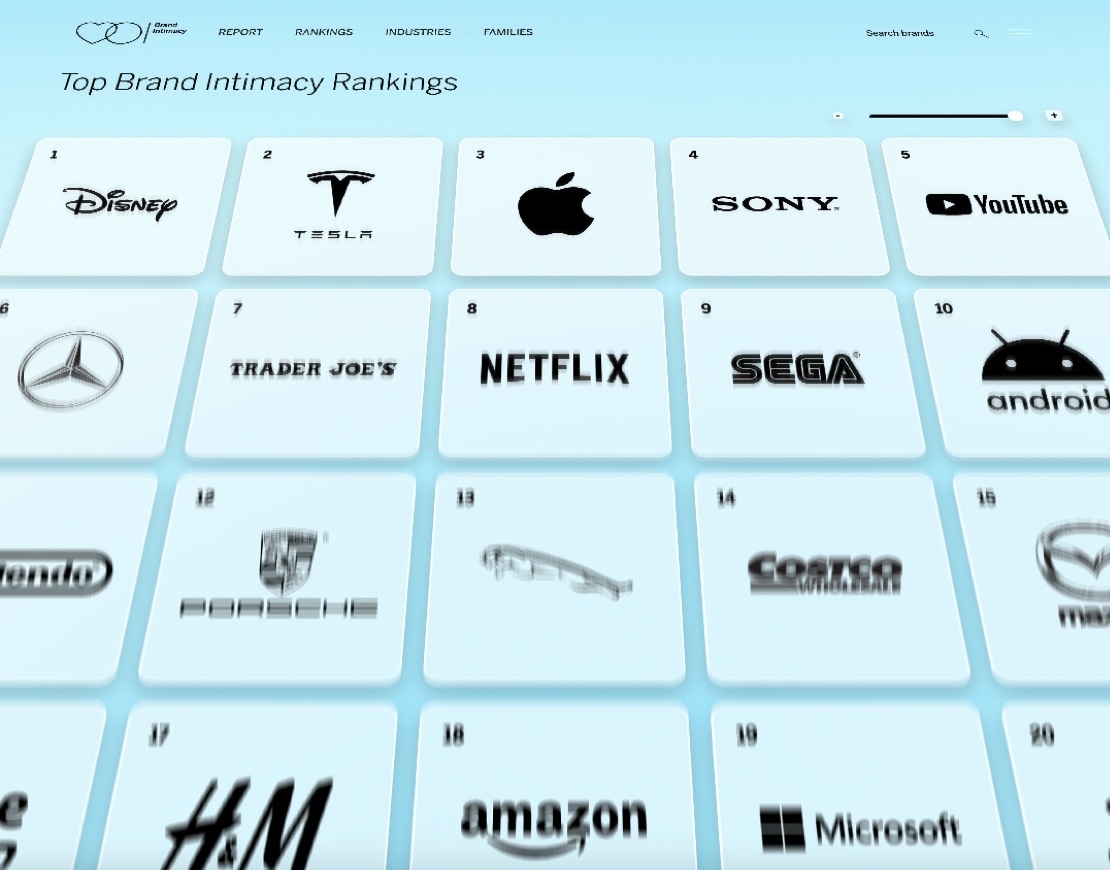
Rankings
Explore the performance of intimate brands, showcasing key measures like archetypes, stages, and keywords along with the ability to view real-time and curated data.
Just Added

Article
Steer clear of brand indifference by reviewing our latest article, pointing out some painful brand failures and tips to keep the love coming.

Explainer
Watch our overview video explaining our latest study and how to find the content you need.

Industries
Review the performance of 19 industries, including several new entries like gaming, crypto, beauty & sports leagues.
Coming Soon
Sign up to be notified about the latest Brand Intimacy releases.
Sign up to be notifiedExplore More

Overview
Explore details on how we conduct our research and how we calculate Quotient scores to rank brands.

Resources
Learn about what Brand Intimacy is, how it works, what it’s based on, and why it matters.

Brand Intimacy Book
Order our Amazon best seller for a comprehensive overview of Brand Intimacy from theory to practice.