Model & Methodology
The Brand Intimacy Model
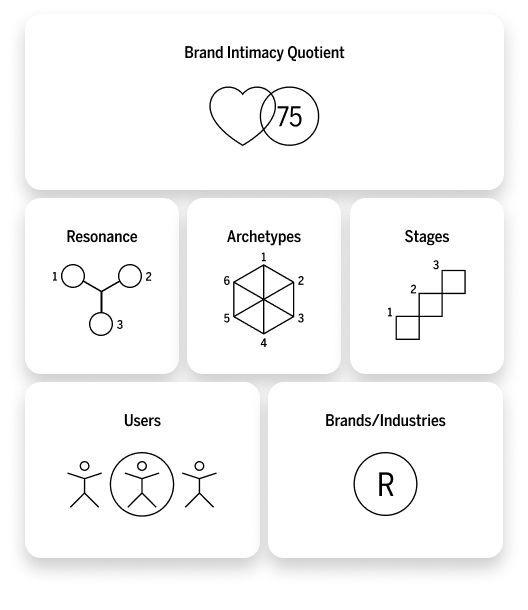
Developed and refined over 16 years of global research, MBLM’s Brand Intimacy Model measures three key components — Resonance, Archetypes, and Stages — that build intimate brand relationships. Together, these components produce the Brand Intimacy Quotient (BIQ), a 0–100 score reflecting a brand’s overall performance. The BIQ and its component measures benchmark intimate brand relationships and reveal the specific levers brands can use to build and sustain them.
Methodology
Methodology
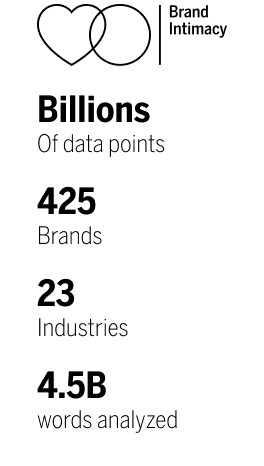
MBLM, in collaboration with Allen Advanced Analytics, conducted a comprehensive analysis of more than 425 brands and over 4.5 billion words across the social internet. This study focused on U.S.-based audiences across seven major social platforms: Facebook, YouTube, Instagram, TikTok, Reddit, and X (formerly Twitter).
Each platform was weighted using a principal component and cluster-based model, incorporating factors such as demographic representation, platform usage patterns, and interaction dynamics. This allowed for a more balanced and representative analysis of brand engagement across generational and behavioral cohorts.
Leveraging advanced artificial intelligence, natural language processing (NLP), sentiment analysis, and MBLM’s proprietary Brand Intimacy measures, we analyzed organic consumer discourse about brands over a rolling 3-to 6-month period.
Each brand was scored on:
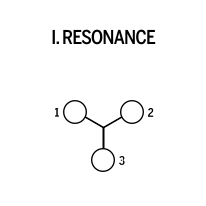
I. Resonance
Describes a brand’s ability to create impact, strike a chord, echo in people’s minds and hearts shaping how they feel and act.

1. Reach
Traces how far a brand’s voice carries — the mentions it earns across every platform we measure.
2. Engagement
Traces how far a brand’s voice carries — the mentions it earns across every platform we measure.
3. Sentiment
Characterizes the emotional tone and valence of conversations.
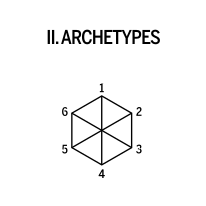
II. Archetypes
Six patterns or markers that are consistently present, in part or in whole, among intimate brands that identify the character and nature of ultimate brand relationships. Archetype scores can vary, with average scores generally being between 25-30.

1. Fulfillment
Exceeds expectations, delivering superior service, quality and efficacy.
2. Identity
Reflects an aspirational image or admired values and beliefs that resonate deeply.
3. Enhancement
Becoming better through use of the brand—smarter, more capable, and more connected.
4. Ritual
Ingraining a brand into daily actions, becoming an important part of daily existence.
5. Nostalgia
Focusing on memories and the warm, poignant feelings associated with them.
6. Indulgence
Centering around moments of pampering and gratification.
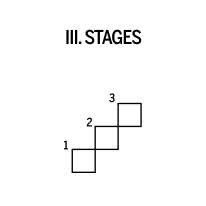
III. Stages
Stages identify the depth and degree of intensity in the relationship between a consumer and a brand. There are three stages of intimacy with criteria for each progression: sharing, bonding, and fusing. Typically scores decrease as you move from sharing to fusing.

1. Sharing
When the person and the brand begin to engage and interact.

2. Bonding
When an attachment is created and the relationship becomes more significant and committed.

3. Fusing
When a person and a brand are inexorably linked and co-identified.

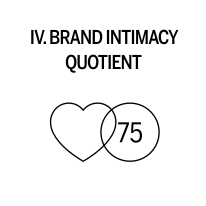
IV. Brand Intimacy Quotient Score (BIQ)
The quotient is the score assigned to each brand from 1 to 100. The quotient is based on prevalence (the percentage of users who are intimate); intensity (where the relationship appears on the spectrum of three stages, sharing, bonding, and fusing, and character (performance on key archetypes). It is a shorthand score that demonstrates how a brand is performing relative to its ability to create ultimate brand relationships, and it enables comparisons to other brands in the same category or to the industry average.
Brand family methodology
Utilizing our Brand Intimacy data, we have created Brand Family rankings. This requires that conglomerates featured have at least three ranked brands from our most recent study. We then averaged the portfolio BIQ scores to achieve a Brand Family Quotient Score. Note that the rankings are only based on portfolio brands included in our Brand Intimacy Study and do not necessarily feature every brand that may be part of a ranked conglomerate.
The Brand Intimacy Fund & Financial Measures & Comparisons methodology
The Brand Intimacy Fund tracks the top 30 brands in the current BIQ rankings, weighted by market capitalization. Constituents are fixed for the duration of each study cycle, with weights rebalanced monthly; each new Brand Intimacy Study reconstitutes the fund to that cycle’s top-ranking brands.
Fund performance is benchmarked against major equity indices and ETFs, detailed separately in accompanying data and charts. Brands that rank highest for intimacy consistently outperform these benchmarks — a pattern that holds across study cycles and points to a real link between customer intimacy and business performance.
We also compare top-ranking Intimate brands with the S&P 500 and Fortune 500 on revenue, gross margin, and net margin. Intimate brands consistently post stronger margins than the broader index — evidence that the emotional bonds consumers form with these brands translate directly into financial results.