Overview:
- We’ve leveraged data from our AI-driven study of 600 brands across 19 industries to better understand building bonds in specific environments or ecosystems. To view our study, click here.
- Brands we ingest are the most intimate among those brands in and around our bodies.
- Devices are the most intimate component of the smartphone ecosystem.
- The office is the most intimate room in our home, containing the brands we most connect with.
Introduction
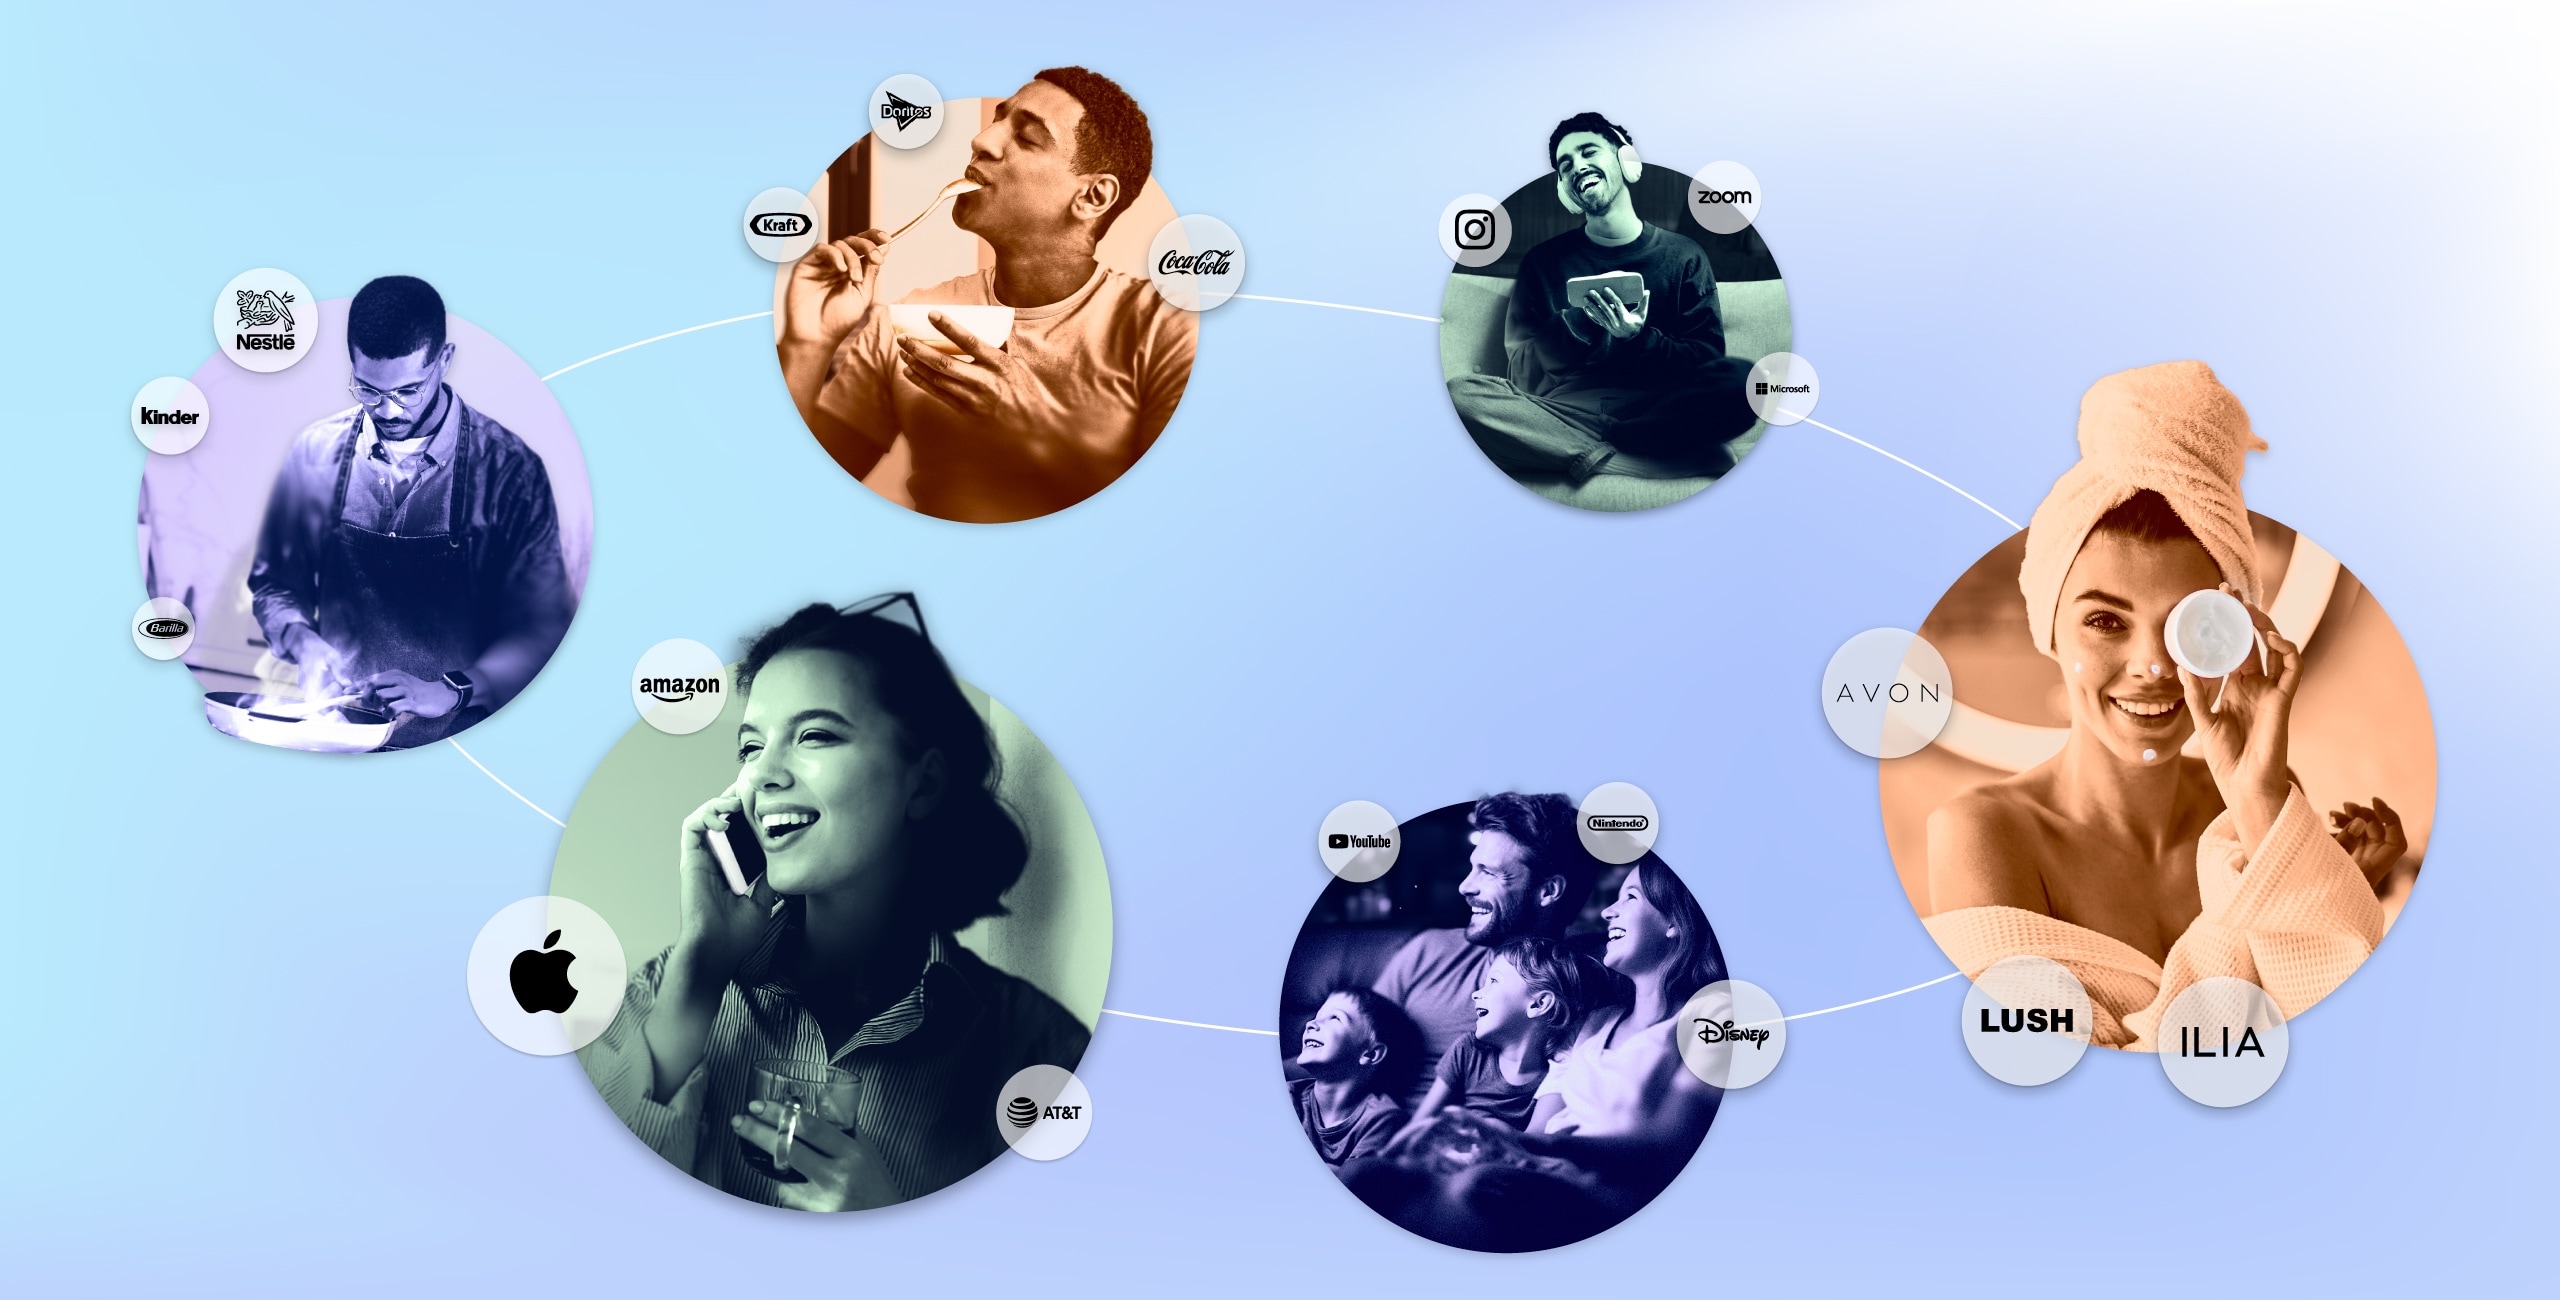
Constantly seeking a deeper way to understand how, where, and why we build bonds with brands, we have added to our insights by looking at brands in situ, rather than in isolation. Organizing brands intuitively into groups, or Brand Ecosystems, based on their roles in our lives and where we interact with them has yielded new findings and richer nuances. In this latest analysis, we look at how consumers connect with brands in three specific environments: our bodies, our smartphones, and our homes.
This data is based on the largest study of brands based on emotion. With over 600 brands and 19 industries featured, we analyzed over 1.4 billion words to determine a brand’s intimacy score, called a Brand Intimacy Quotient Score, and better understand how it is building bonds with consumers.
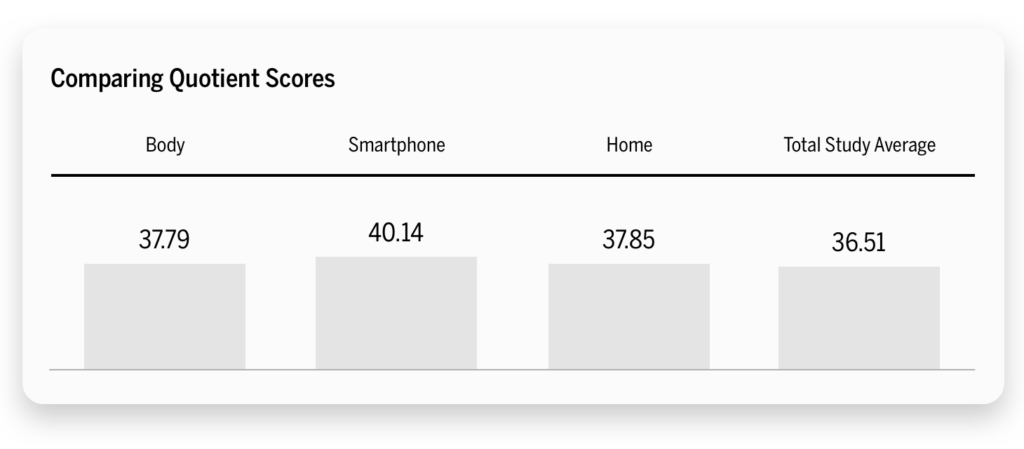
It is interesting to note that the scores across the three ecosystems we’ve reviewed are quite similar, and all are higher than the average Brand Intimacy score across our study, suggesting that the environment can contribute to our ability to form strong, intimate connections with brands.
I. BODY
This environment itself is the most intimate and personal we reviewed. One might expect that brands we use near or on ourselves may form stronger bonds than brands that we use from a distance. Within this ecosystem, we have created three groupings: brands we eat, brands we wear, and brands we apply.
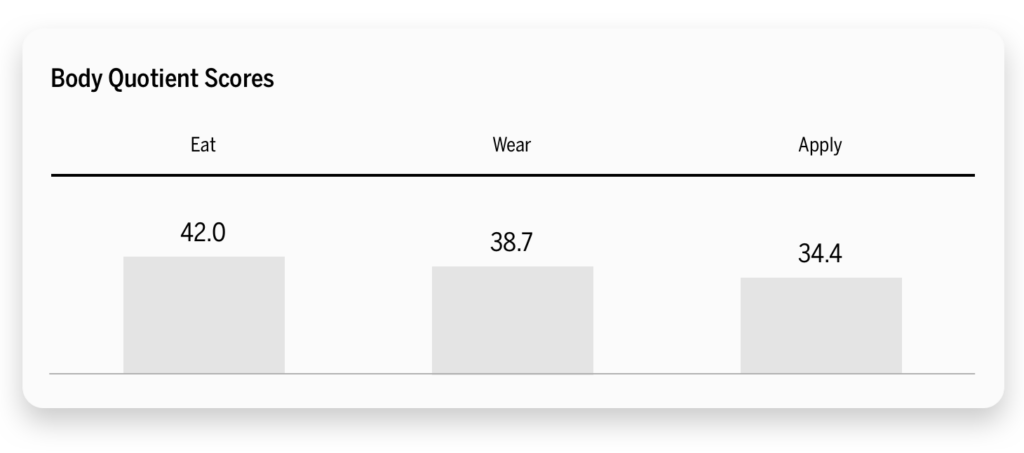
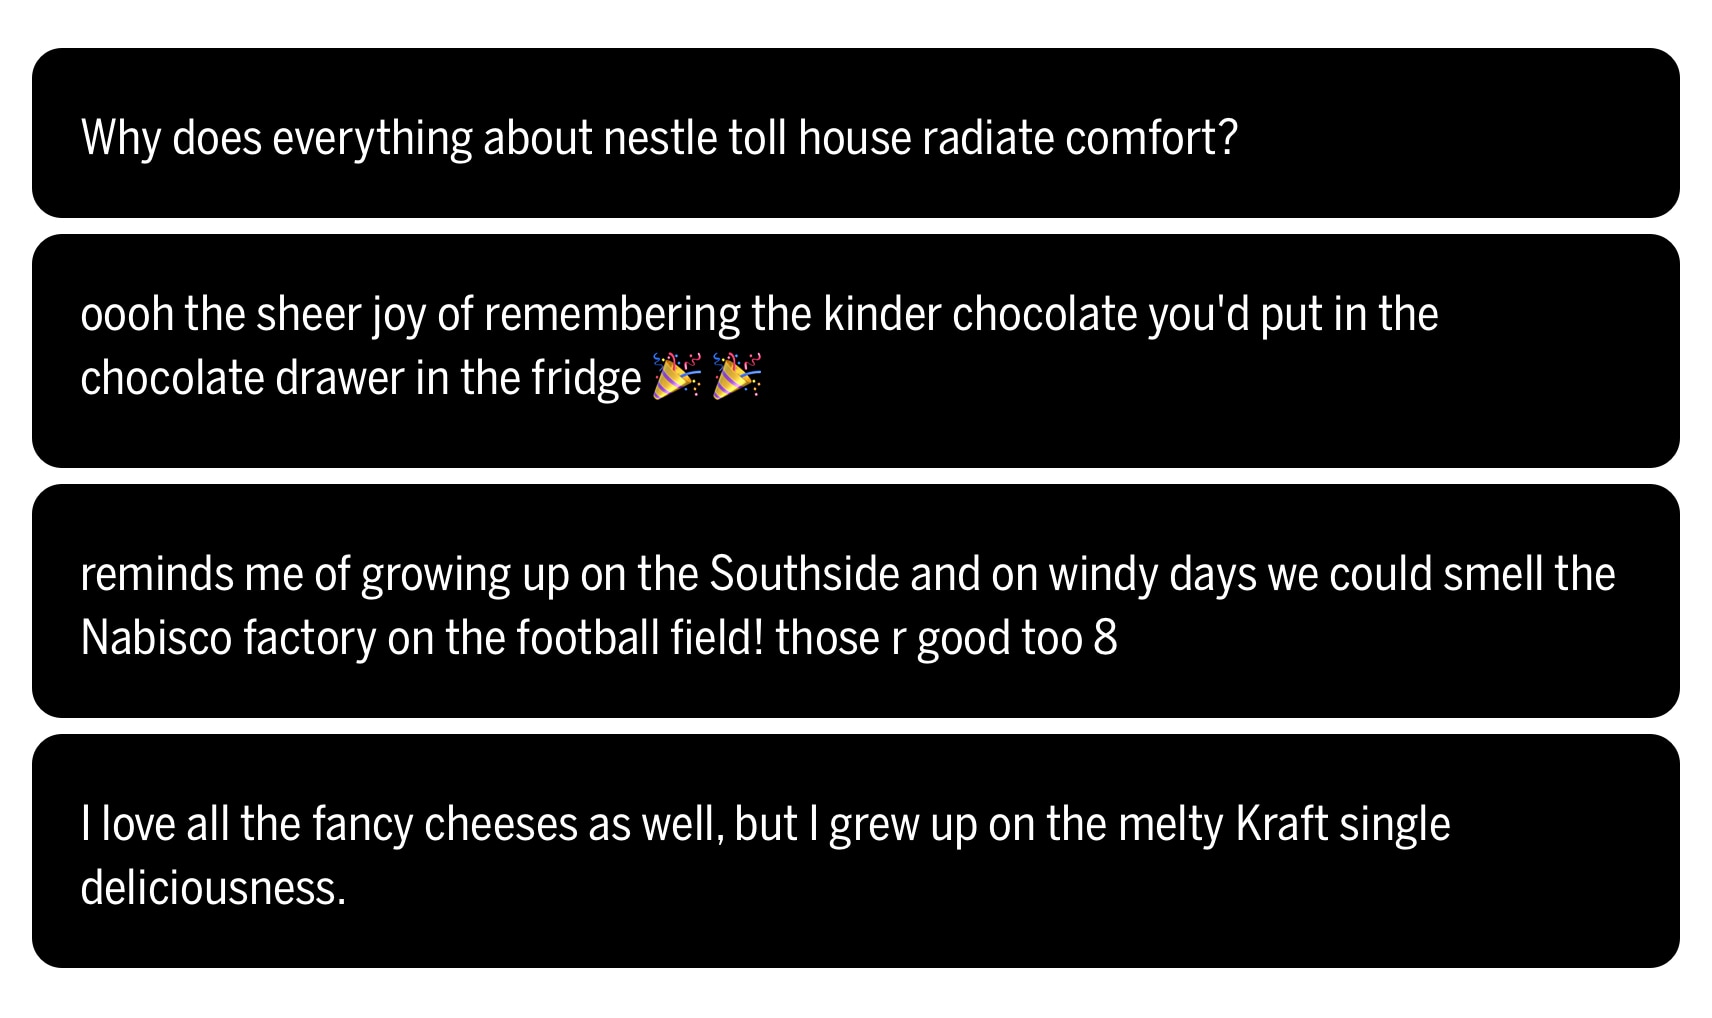
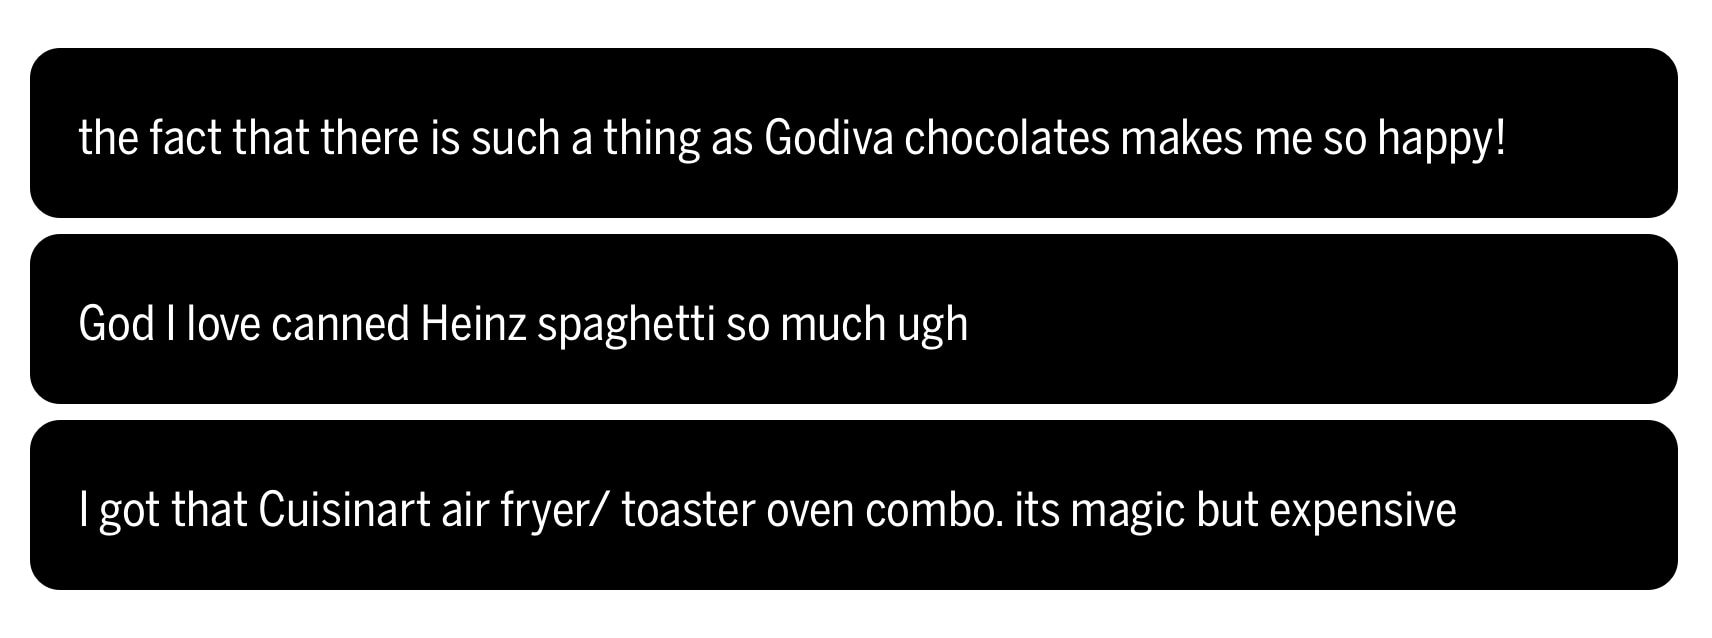
We discovered that we are most intimate with brands we eat. This is likely because these brands go directly into our bodies, necessitating a high level of trust and confidence that they are safe and cannot harm us. Additionally, brands we eat are often associated with strong emotions like happiness and nostalgia. In fact, nostalgia is the dominant archetype for these brands, further highlighting the comfort and warm associations of the past we get when ingesting our favorite foods. Interestingly, we also have stronger connections with sweet versus savory brands.
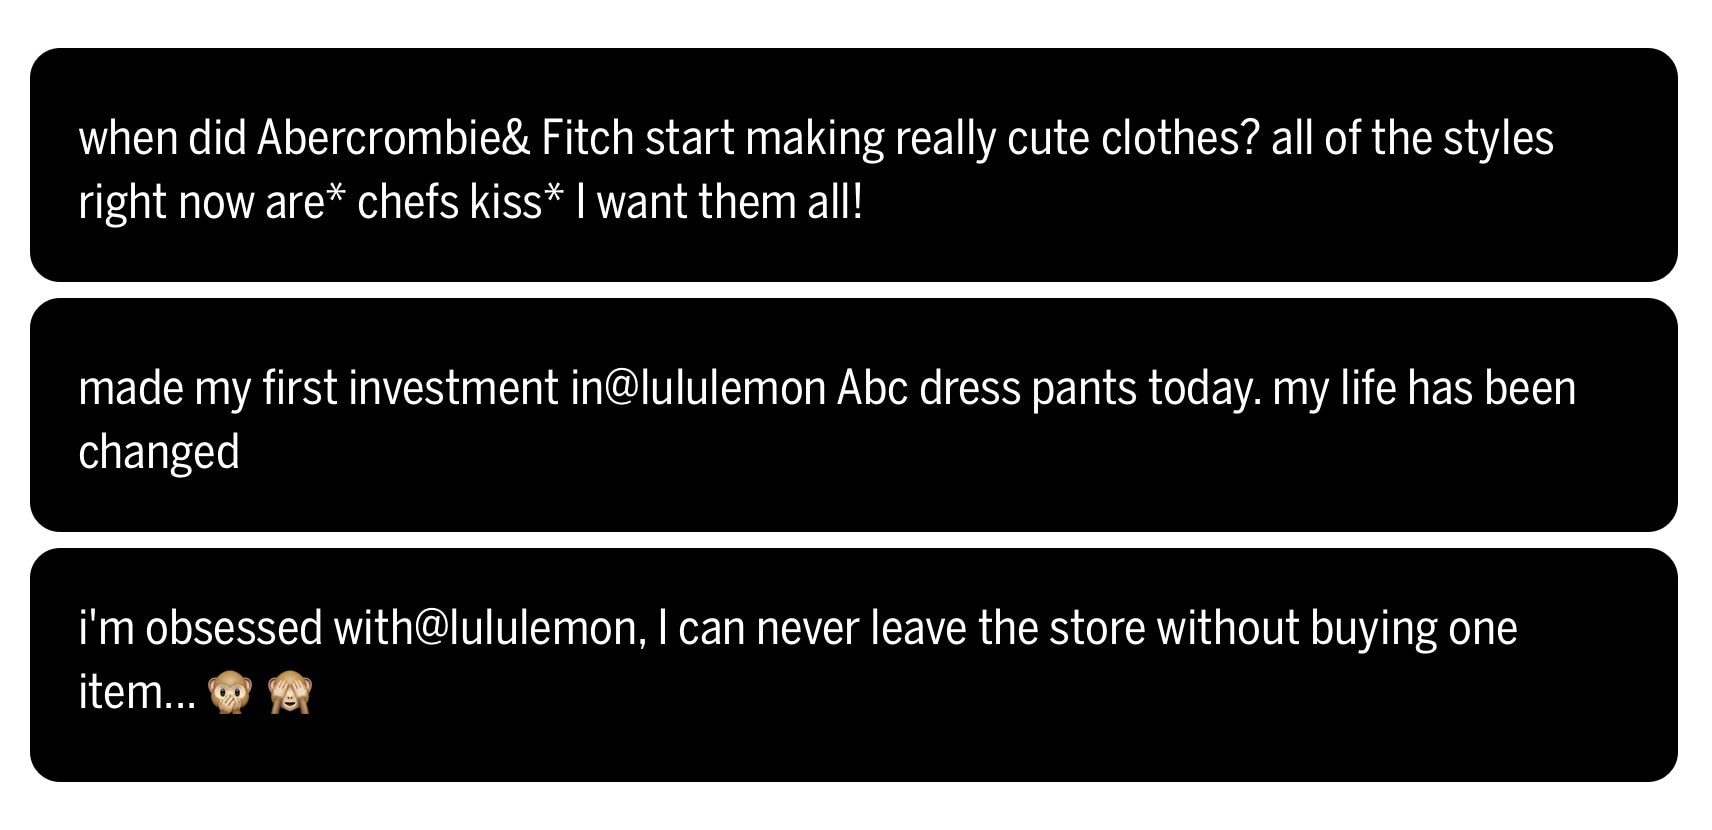
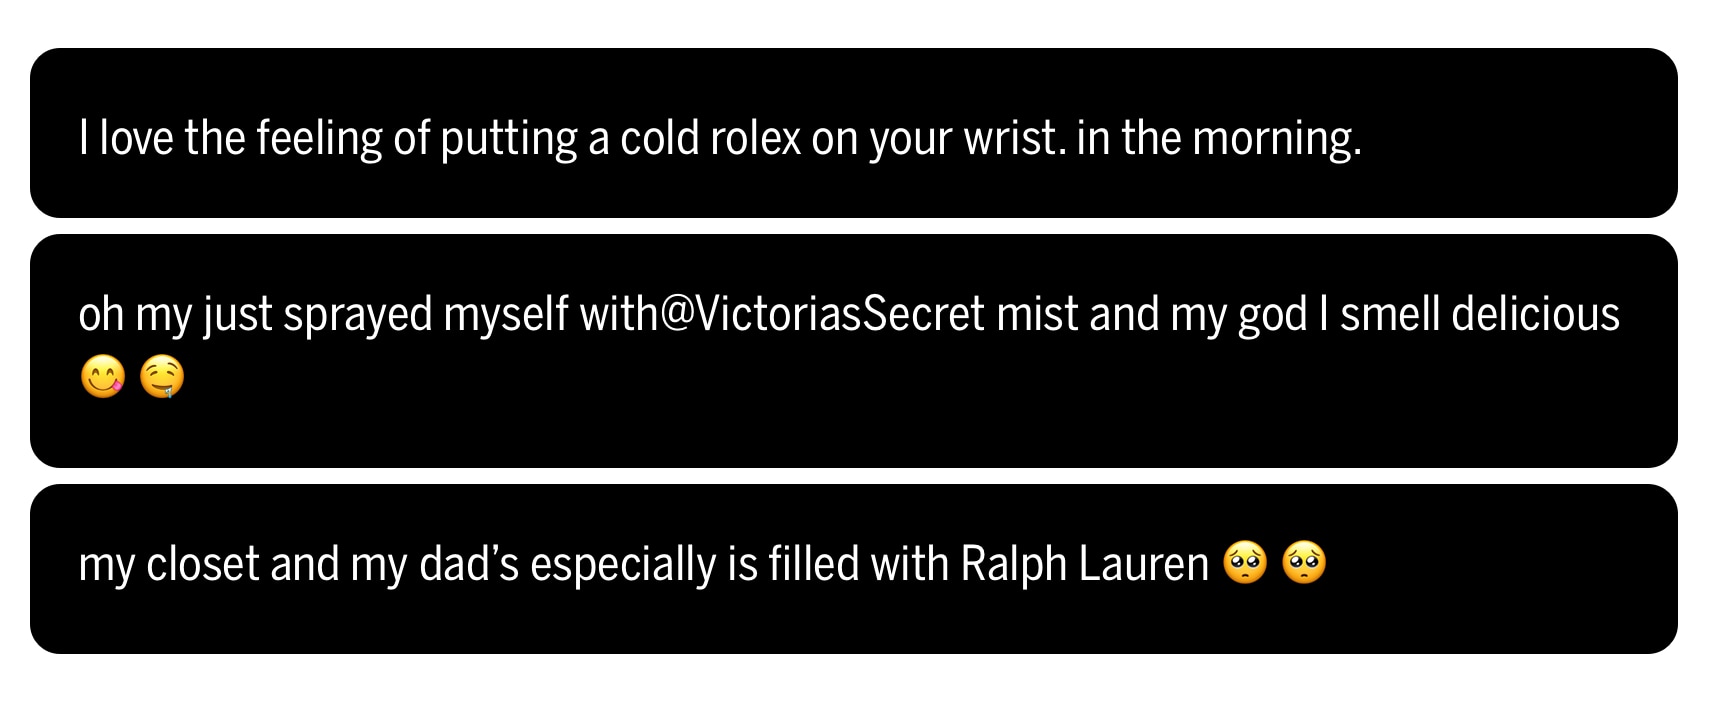
Brands we wear come as the second-most intimate after brands we eat. Although on top of the body, these brands cover intimate areas of our body and often convey a strong sense of identity about who we are. We also tend to connect more strongly with sports brands vs. other apparel, which may further link to identity and establishing shared values. Fulfillment is the dominant archetype, highlighting the performance and quality we expect from these brands.
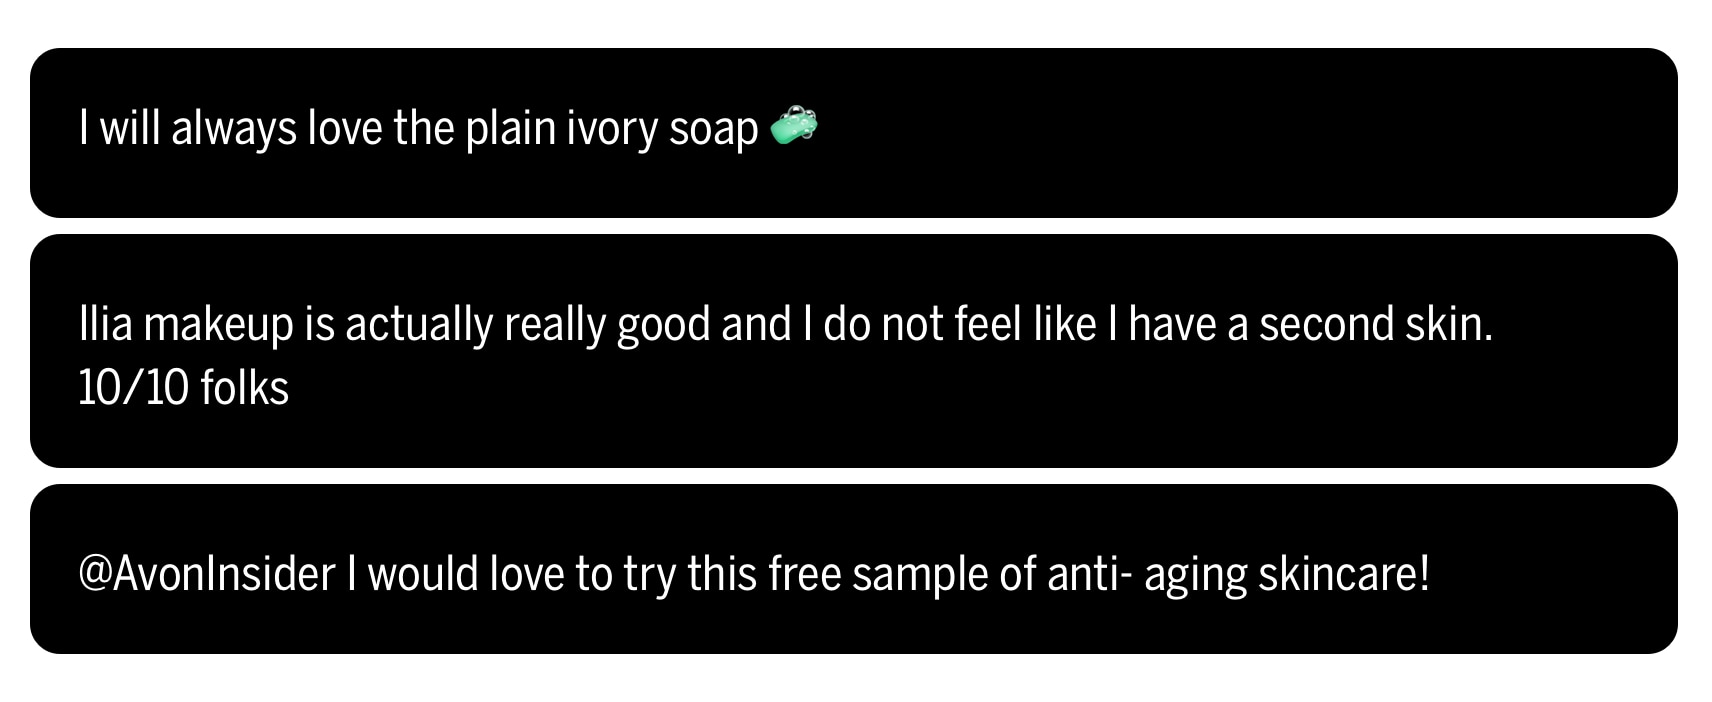
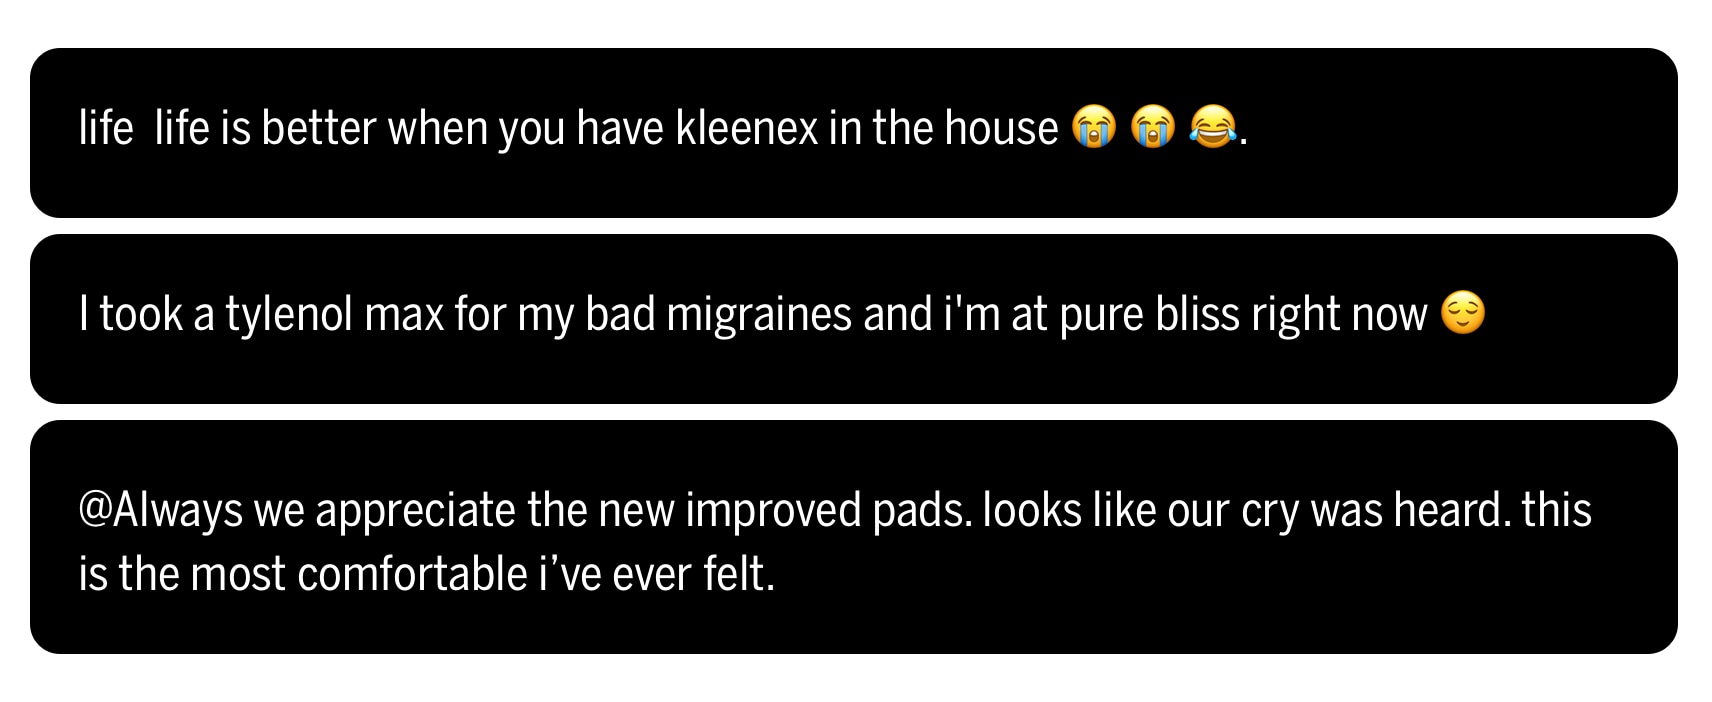
In third place are the brands we apply. Think of beauty products or health & hygiene brands. Perhaps because they are on top of our face, skin, and hair and more temporary in nature, they are seen as less intimate. We bond more with health-related brands versus beauty brands, perhaps because they serve a more essential function. Fulfillment, centered on quality and performance, is the dominant archetype.
II. SMARTPHONES
The concept of the smartphone ecosystem refers to brands that fall into the categories of smartphone manufacturers, content/info and services, access, and apps. This community of brands has transformed modern life, enabling us to connect with others and access information faster and more efficiently than ever before. In this way, our phones have basically consolidated our entire lives into our pockets. We have grown increasingly dependent on them, with a recent survey revealing the average American is now spending 4–6 hours a day on their smartphone, with this average increasing to 6–8 hours for Gen Z respondents.1
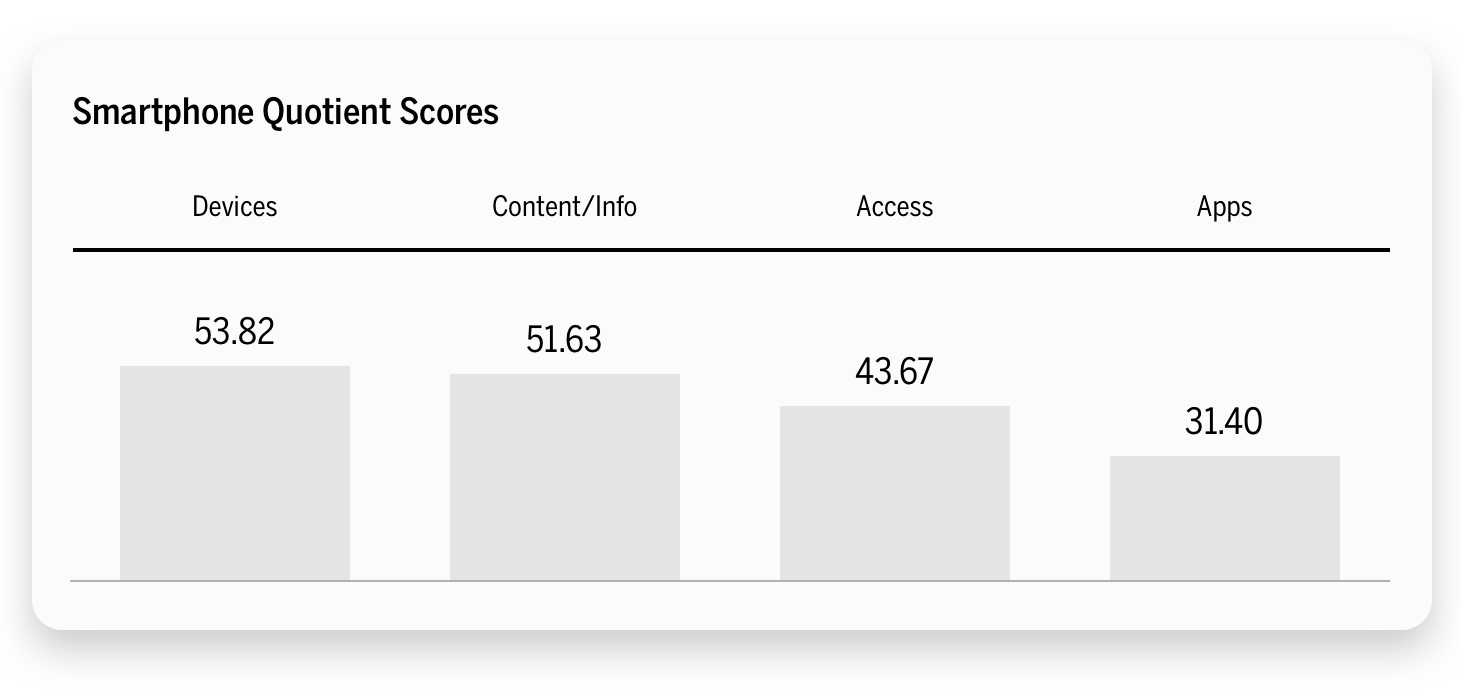
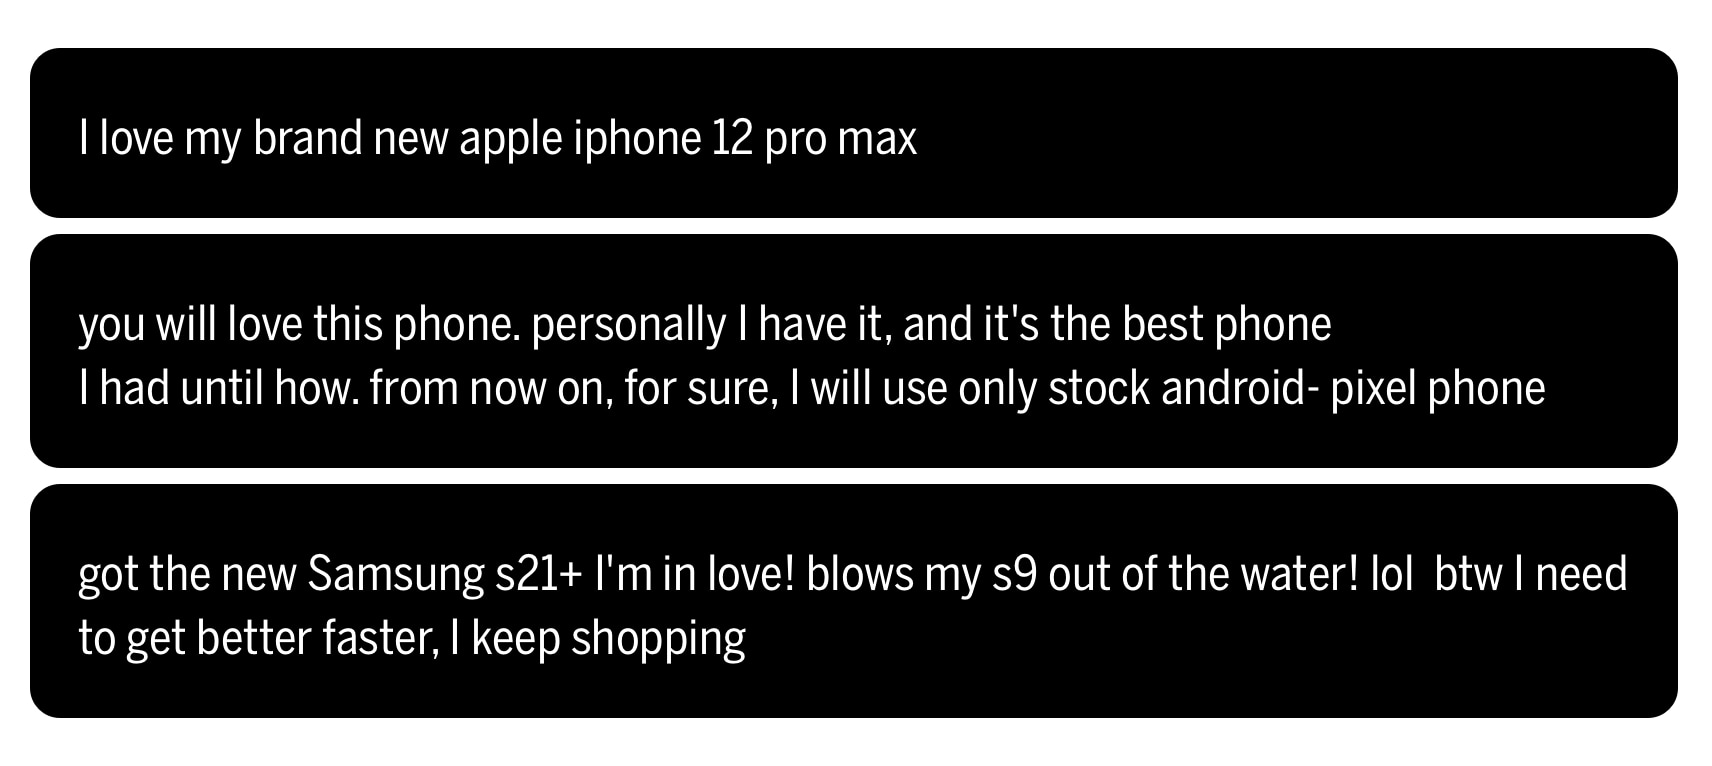
The most intimate group of brands in the smartphone ecosystem is devices, the manufacturers of smartphones. Tangible in nature, they are the physical medium and interface between us and technology. Devices are how people identify their phones (iPhone, Android) and, therefore, may serve as the umbrella or top of the spear for all that their smartphone contains. Enhancement, which is about making the user smarter, more capable, and more connected, is the dominant archetype.
Content/Info
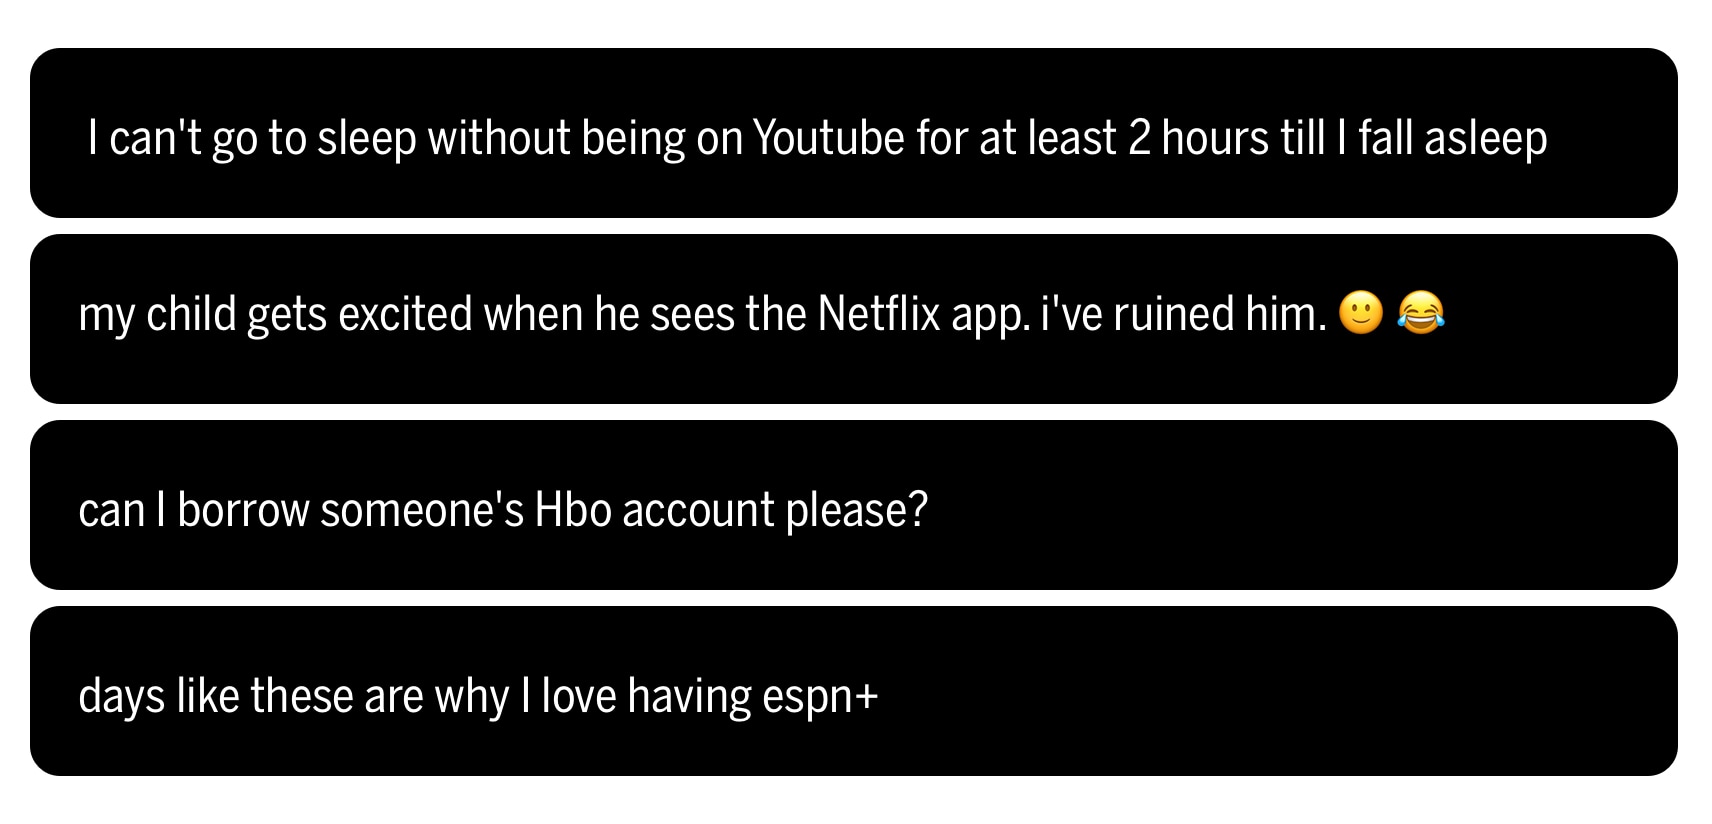
The second-most intimate group of brands in the smartphone ecosystem falls under content/information. Streaming platforms offer a vast array of entertainment and information tailored to individual preferences, fostering a sense of personalization and relevance that has undoubtedly contributed to the intimacy consumers feel for these brands. Fulfillment is the dominant archetype, which reflects brands exceeding expectations and delivering superior services with quality and efficacy.
Access
Ranking as the third-most intimate, access brands are instrumental in powering our devices, yet consumers don’t necessarily perceive them as equally important. Despite their critical role in keeping us connected, access brands are often viewed as a means to an end. Consumers value the services they provide more for their convenience than for the formation of deep emotional connections. Enhancement, which is about making the user smarter, more capable, and more connected, is the dominant archetype.

Apps
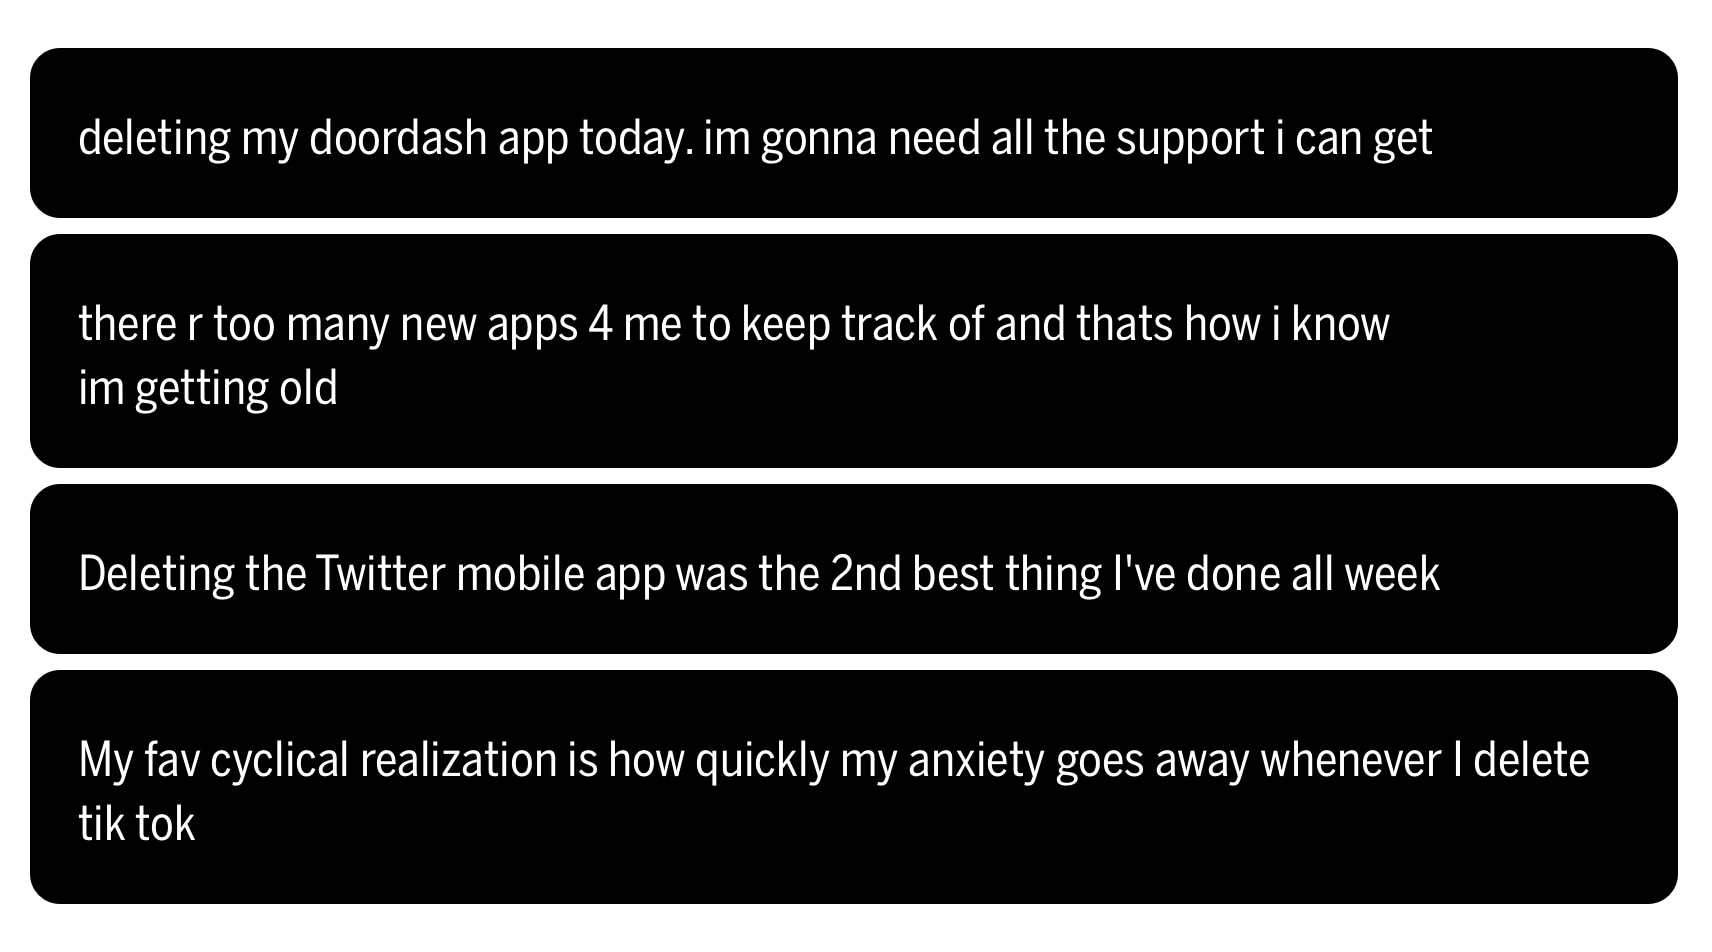
The most saturated yet least intimate subgroup of the smartphone ecosystem is Apps.
They are perceived as more utilitarian, informing how we connect with them. Consumers, in general, are also less dependent on apps compared to physical devices or content. Statistically, 21% of apps are used only once during the first six months. Moreover, the global mobile app uninstall rate after 30 days is 28%, meaning almost 3 in every 10 apps will be deleted from users’ devices within a month.2
III. HOME
People are increasingly spending more time at home.3 Even before COVID-19, many were calling this era the “indoor generation.”4 Given how much of our lives are lived at home, we wanted to look at different rooms within the home to see how we build bonds with the brands and where we form the most intimate connections. Here we see the intersection of how top performing industries like media & entertainment or automotive positively impact environments where we live.
Office
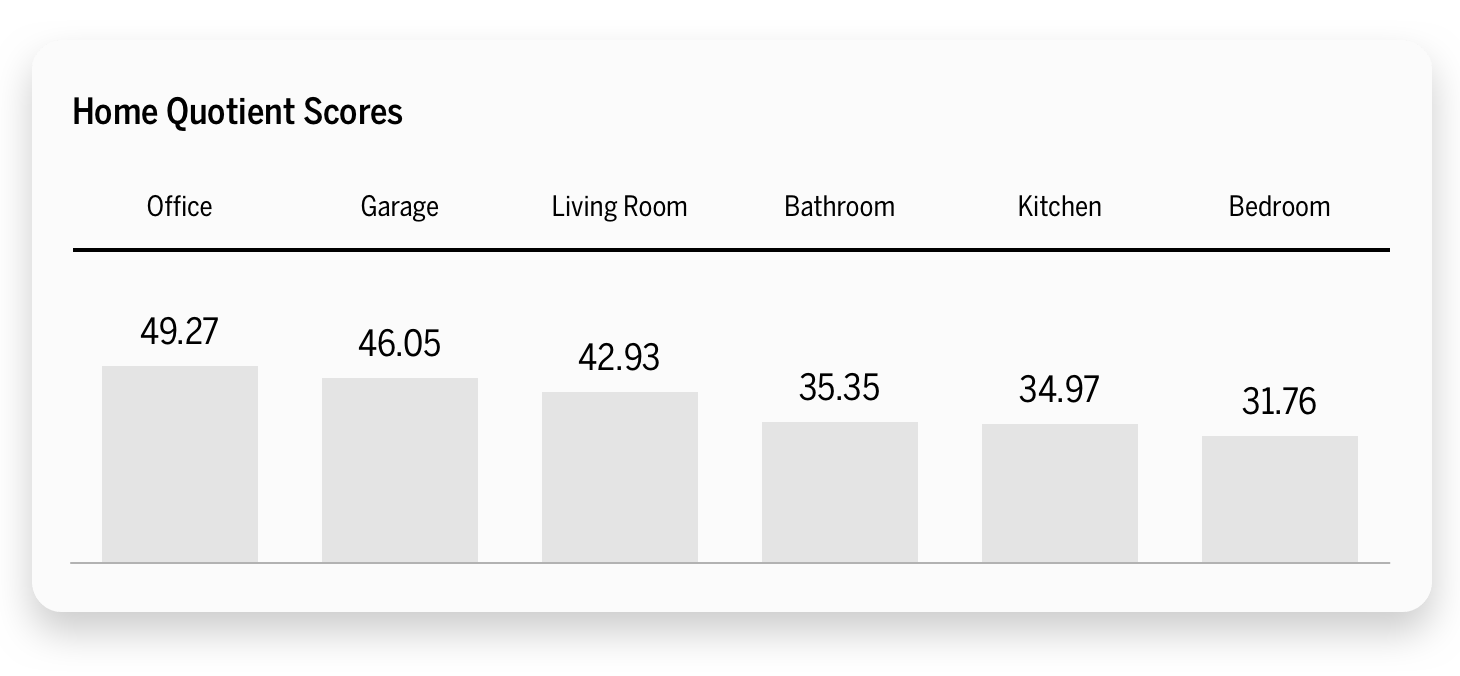
Buoyed by technology brands and our more remote/hybrid working lives, our home office space features the brands we are most intimate with. This room has also been a place of escape and focus for many amidst the chaos and craziness of family life. Since the pandemic, we have seen increases in everything from the home office furniture market to residential real estate listings that mention a home office. The enhancement archetype dominates here, with users feeling better, smarter, more capable, and more connected through the use of the brand.

Garage
The garage is the second most intimate room in our homes. Cars have always been strong intimate performers, holding a special place in our hearts. Automotive brands transcend their utility for transport and are often symbols of aspiration and fulfillment, which is the dominant archetype.

Living Room
In the space dedicated to entertainment and leisure, we see the strong performance of media & entertainment brands as well as gaming brands reflecting the environment we live in. Now, with countless binge-watching opportunities, sports, and gaming options, the living room is a place where many eat, sleep, and relax.

Bathroom
The bathroom ranks as the fourth-most intimate room in the home. A highly personal space, it’s where we engage in daily routines and manage self-care, pampering, and our basic necessities. Ritual is the most dominant archetype, highlighting when a brand becomes a vitally important part of our every day.
Kitchen
Often called the heart of the home, the kitchen ranks as the fifth-most intimate room in the house. Encompassing food, beverage, and appliance brands, its performance may be a result of an overall decline in home cooking (31% of Americans do not cook on a regular basis)6 or the fact that we now often take food from the kitchen and eat it in rooms like our home office or the living room. Nostalgia is the dominant archetype here, with indulgence a close second.
Bedroom
Perhaps one of the bigger surprises in the study is that the bedroom ranks as the least intimate room in the house. Remember, though, we’re talking about brands we’re intimate with, so it may be that people spend more time in other parts of their home or that the brands featured in a bedroom, primarily apparel and valuables, may matter less than technology and media and entertainment brands.
Conclusion
Our analysis of environments has highlighted that how intimate we are with a brand may also be impacted by the places and ways in which we interact with it. Brands have resonance in context, not in isolation, and this is rarely featured in marketing and communications. What else we are doing when interacting with a brand and where we are doing it has implications that can increase and intensify our feelings for a brand. This insight gives marketers another gold mine of rich ways to add to their brand experiences, communications, and focus. Our initial three areas of focus show that, often, different contexts enable more nuanced expressions, and brands that connect to us in the right spaces and places exceed the average performance of intimate brands in our study.
Moving forward, both consumers and brands may find it useful to reflect on how they participate and connect with brands in different environments. Savoring a piece of chocolate at the end of the day at home versus grabbing it to eat on the run. Checking your Twitter feed or Instagram during your lunch break versus sending an urgent text message. Escaping, to your home office to watch a video in private versus retreating to your living room for family fun. Understanding the way we interact with brands in different spaces provides a more sophisticated perception of all the ways we may want to promote the brand and acknowledge the very different experiences it provides.
Get an overview of Brand Intimacy here.
Read our detailed methodology here. Our Amazon best-selling book is available at all your favorite booksellers. To learn more about our Agency, Lab, and Platform, visit mblm.com.
Sources
1 “Our average screen time is now a whopping 4 – 6 hours per day (or 3 months per year).” By psychnewsdaily.com
Source no longer available
2 “New data shows uninstalls remain a significant pain for apps” By appsflyer.com https://www.appsflyer.com/blog/trends-insights/app-uninstall-trends/
3 “How Much More Time We Spent at Home” By flowingdata.com https://flowingdata.com/2021/09/03/everything-more-from-home/#:~:text=Based%20on%20the%20American%20Time,spent%20about%2050%%20in%202019.
4 “’Indoor generation’: Here’s how much time we spend indoors” By Deseret News https://www.deseret.com/2018/5/17/20645140/indoor-generation-here-s-how-much-time-we-spend-indoors#:~:text=And%20that’s%20more%20than%20we,%20percent%20(about%2021%20hours).
5 “Home Office Furniture – Worldwide” By statista.com https://www.statista.com/outlook/cmo/furniture/home-office-furniture/worldwide and “The Popularity Of The Home Office In Real Estate.” By rockethomes.com
6 “How Many Americans Cook at Home in 2023” By Testhut https://www.testhut.com/how-many-americans-cook-statistics/#:~:text=Statistics%20show%20that%20only%207,have%20mixed%20feelings%20about%20it