Overview:
- It is estimated that there are 6.92 billion smartphone users in the world today, making up about 86% of the world’s population.1
- We continue to find that brands that are part of the smartphone ecosystem (including devices, content/info, access, and app brands) generally outperform those that are not.
- Patterns related to devices, content/info, access, and apps have remained consistent over the past several years.
Introduction
The concept of the “smartphone ecosystem” refers to brands that fall into the categories of smartphone manufacturers, content/info and services, access, and apps. This community of brands has transformed modern life, enabling us to connect with others and access information faster and more efficiently than ever before. In this way, our phones have basically consolidated our entire lives into our pockets.
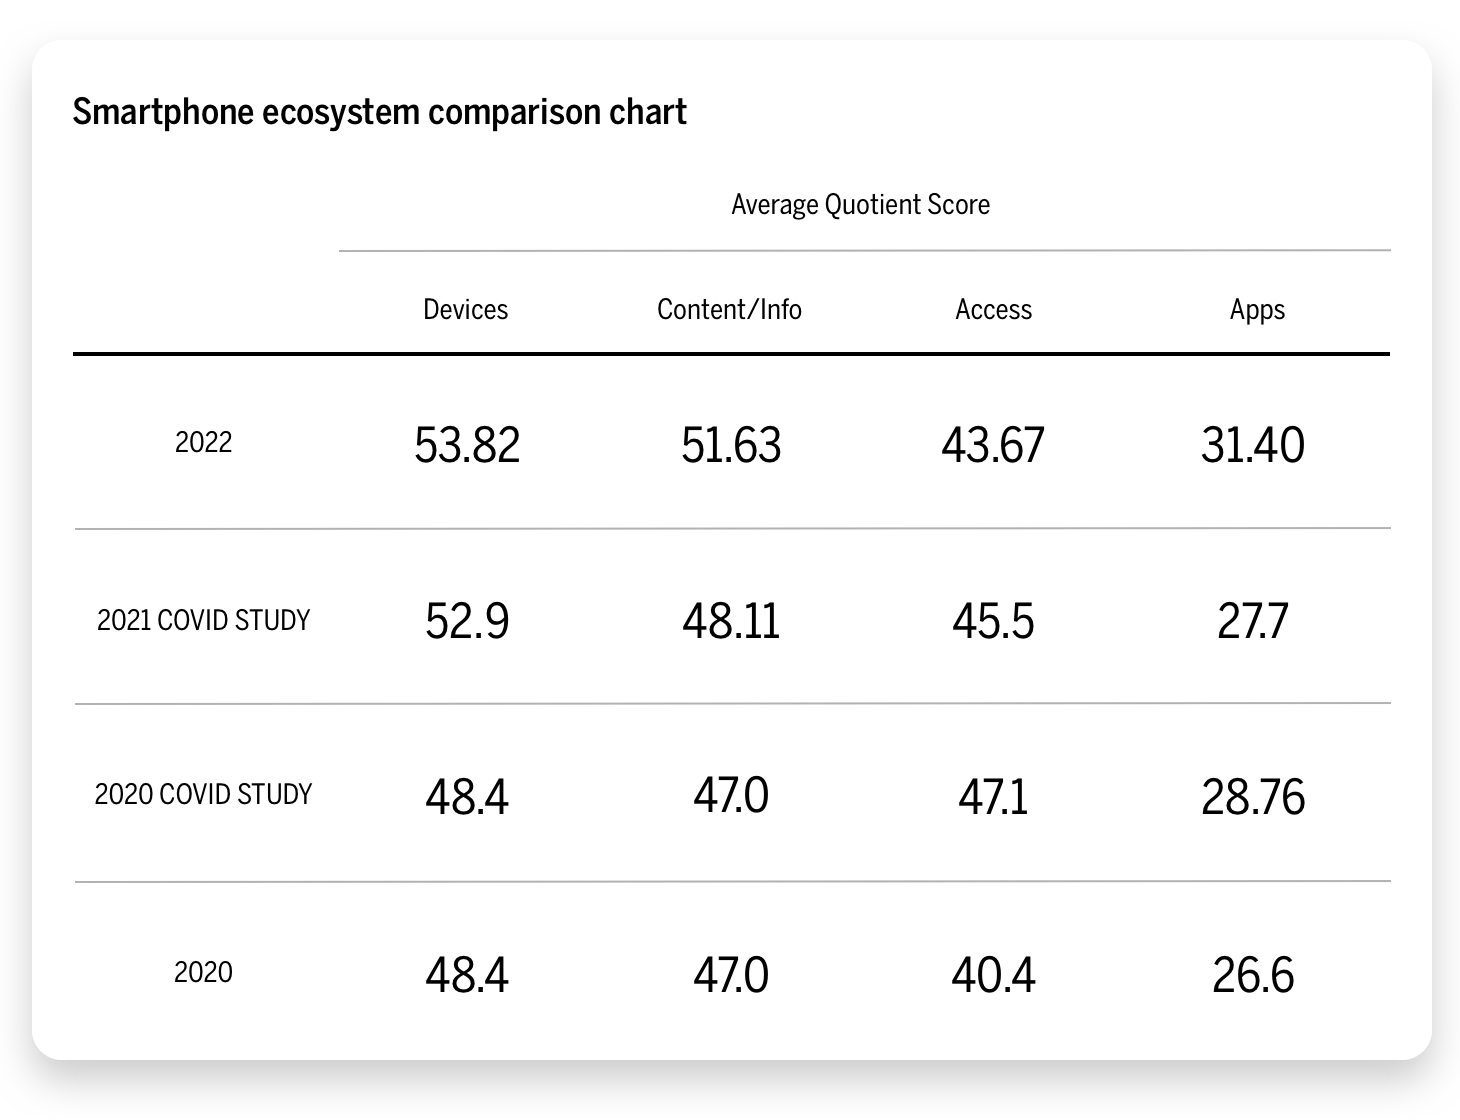
Each year, we conduct the largest study of brands based on emotion. With over 600 brands and 19 industries featured, we analyzed over 1.4 billion words to determine a brand’s average intimacy score (called Brand Intimacy Quotient) and better understand how it is building bonds with consumers. Using the results of our annual study, we have been reviewing the performance of brands falling into the “smartphone ecosystem” for years. To read our previous article, The Smartphone Ecosystem, click here. Looking at the Brand Intimacy averages for these groups of brands and comparing them to the results of our previous Brand Intimacy studies reveals a consistent pattern, showing that brands in the smartphone ecosystem continue to generally outperform those that are not. Similarly, Average Quotient Scores for each subgroup have remained relatively stagnant over the past four studies.
The Smartphone Ecosystem
The rise in smartphone usage has boomed over the past decade. In 2023, the number of global smartphone users is estimated at 6.8 billion, marking a 4.2% annual increase and an 86.5% increase in the number of smartphone users in 2016. Domestically, 97% of Americans own some kind of cellphone, with 85% owning some form of smartphone.2
A recent survey revealed the average American is now spending 4-6 hours a day on their smartphone, with this average increasing to 6-8 hours for Gen Z respondents.3 Reliance on smartphones for online access is shown to be particularly common among younger adults and lower-income Americans.
The constantly growing list of smartphone capabilities incentivizes users to spend time normally spent elsewhere on their mobile devices. For instance, the growth of streaming services and online news formats coupled with a decrease in the number of cable subscribers contributes to increasing use of smartphones. Similarly, with social media usage becoming a necessity in individuals’ daily lives, the need for a smartphone device to access these platforms becomes increasingly elevated.
Devices
Once again, the most intimate group of brands in the smartphone ecosystem is devices, the manufacturers of smartphones. Brands like Apple, Samsung, Microsoft, LG, HTC, Android, Google, and Panasonic are strong not only in the smartphone ecosystem, but also in the overall Brand Intimacy study (Apple ranks 3rd overall and Microsoft ranks 19th overall in our 2022 report).
Smartphones have become necessary tools in today’s society, connecting us with people, information, content, and even food. As such, it makes sense that devices dominate the smartphone ecosystem with the highest average quotient score—53.82—a score over 20 points higher than the average quotient score of apps brands. People’s primary associations with their phones are more often the phone’s manufacturing brand (iPhone, Android) rather than the content on their devices.
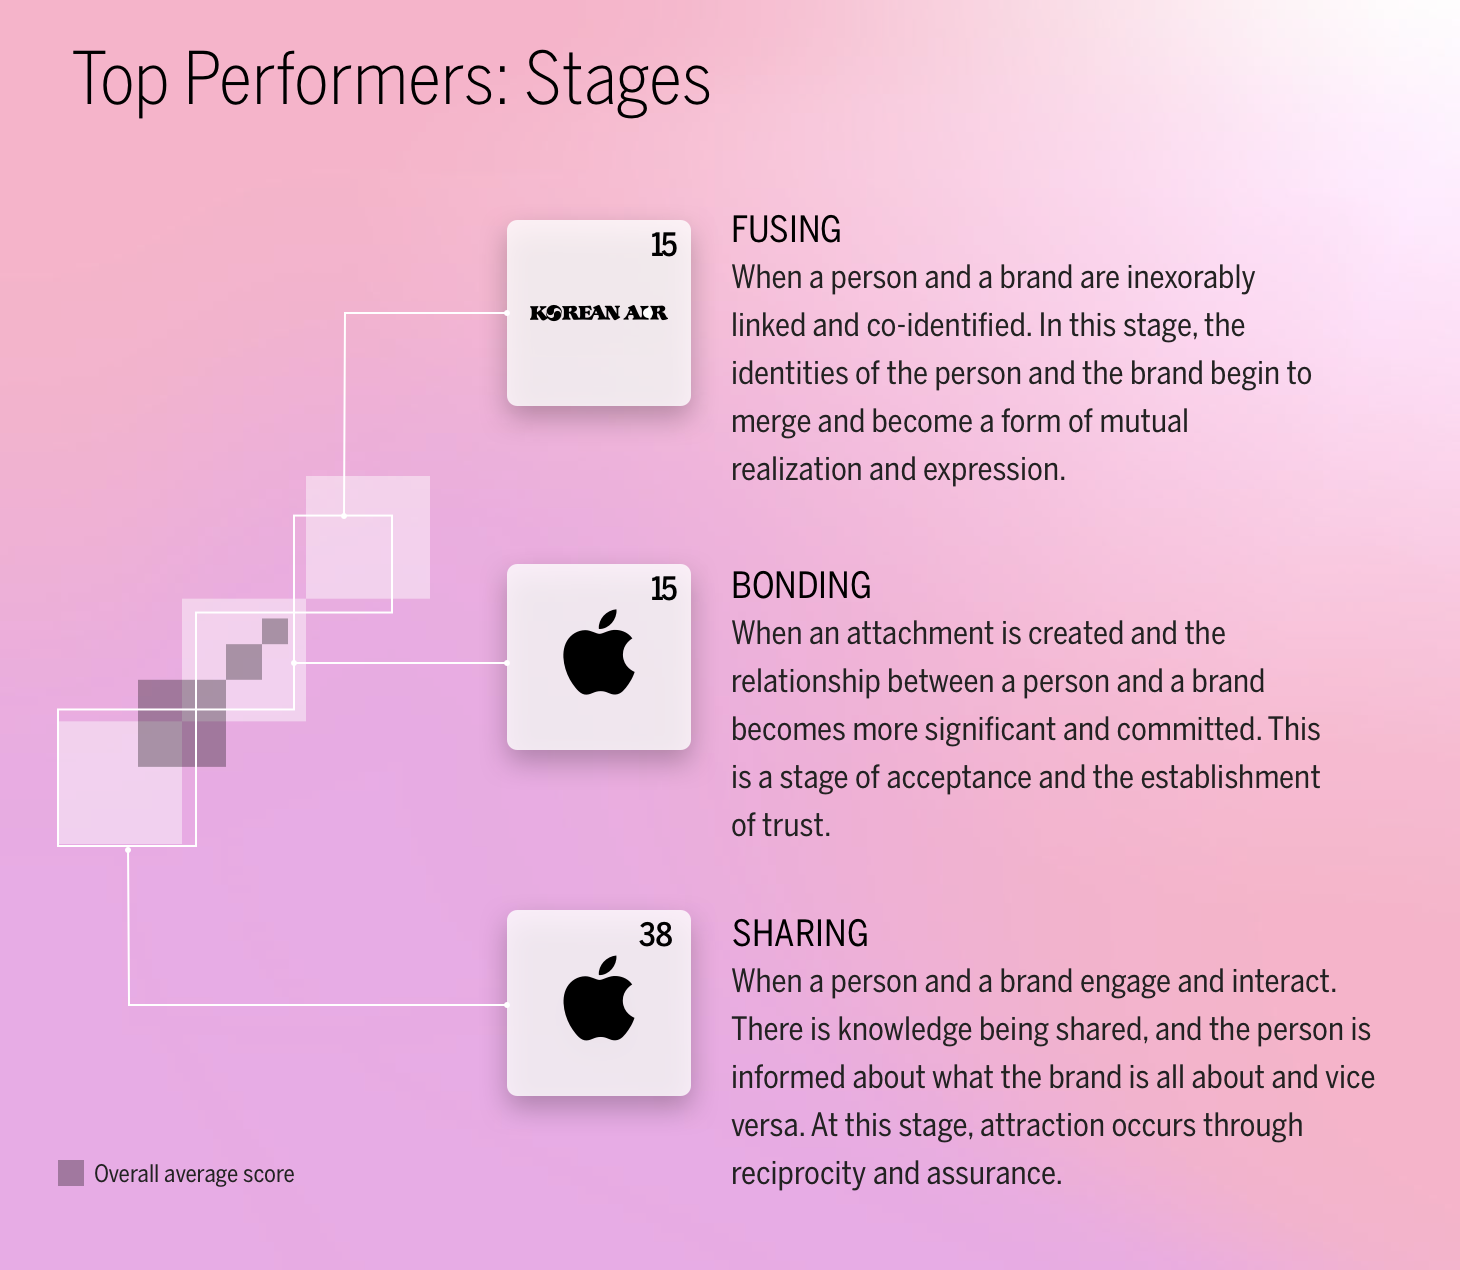
Apple, the highest-ranking brand in the smartphone ecosystem, is also a top performer in Brand Intimacy stages. These stages identity the depth and degree of intensity in the relationship between a consumer and a brand. There are three stages with criteria for each progression: sharing, bonding, and fusing. Apple, notably, is the top-performing overall brand in both the sharing and bonding stages, an impressive feat.
Moreover, with the exception of Samsung and Panasonic, each of the devices brands’ dominant archetypes are enhancement—meaning customers become better through use of the brand—smarter, more capable, and more connected. Samsung and Panasonic, on the other hand, share fulfillment as their dominant archetype, which reflects brands exceeding expectations, delivering superior services quality and efficacy.
With such a strong dependency on devices, their utility forces consumers to continue to spend money on their products. Advancements in smartphone technologies also expand their functionality and uses. For instance, smartphones with high-quality camera and video offerings allow users to forgo the purchase of a separate camera in favor of their phone’s camera.
Content/Info
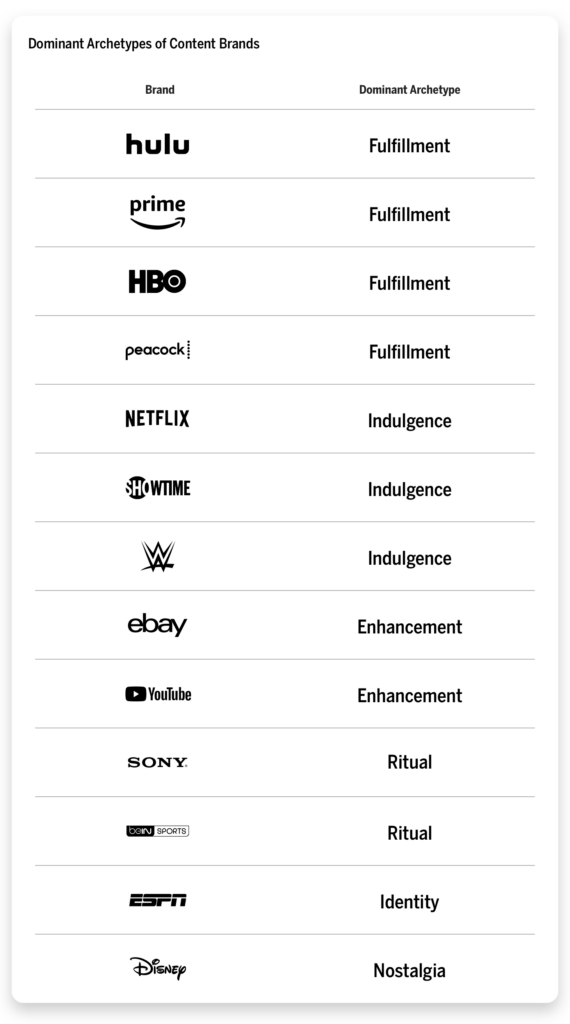
The second most intimate group of brands in the smartphone ecosystem falls under the content/information category. With an average intimacy score of 51.63, these brands provide access to content ranging from television/movies to sports and the news and include Disney, Hulu, ESPN, HBO, Netflix, Amazon Prime, eBay, Sony, Showtime, Peacock, beIN Sports, WWE, and YouTube.
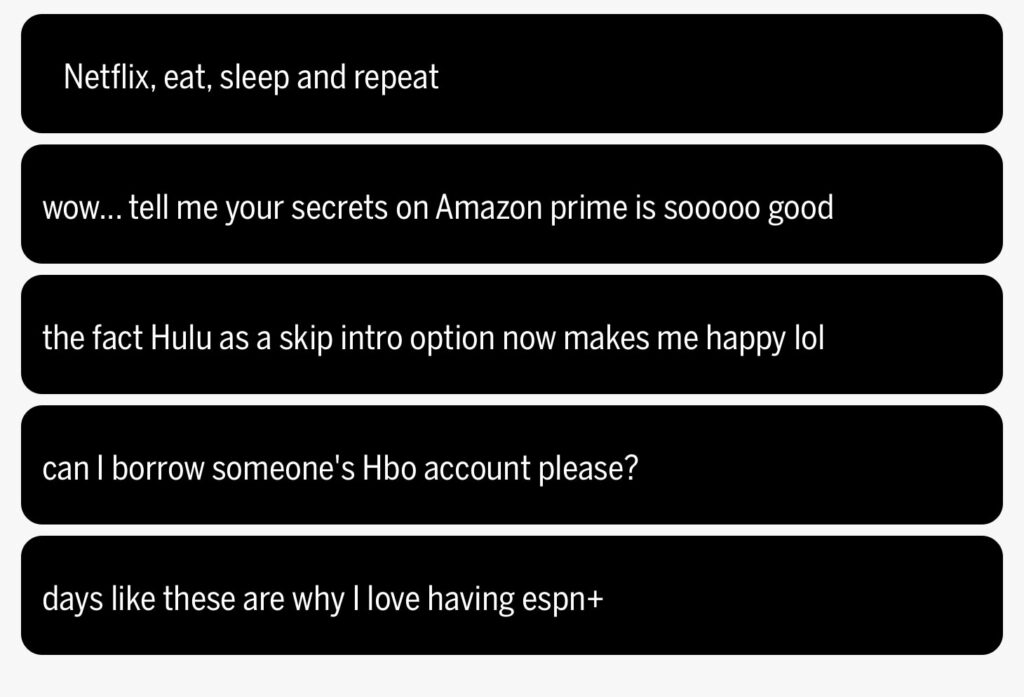
With a massive shift in the way we consume content, streaming services and online content have become the new normal. It is estimated that more than eight in ten US adults get their news from a smartphone, computer, or tablet “often” or “sometimes”. This statistic reveals that more people report getting their news from devices than from TV.4 The rise in popularity of streaming services over traditional cable is also reflected in these results. In July 2022, streaming represented a record-breaking 34.8% share of total television consumption, exceeding cable (34.4%) and broadcast (21.6%).5
In contrast to devices, which have a more unanimous, dominant archetype, content/info brands have more varied dominant archetypes, which is not surprising given the variety of content/info brands. For instance, Disney’s dominant archetype is nostalgia, ESPN’s is identity, YouTube’s is enhancement, and HBO’s is fulfillment. Similar to the device subgroup, content/info brands also do well in our overall rankings, with Disney ranking #1.
This suggests there is no one archetype that is most linked to building bonds in the content/info space. Brands are able to form emotional connections based on whatever best aligns with their offerings and approach.
Access
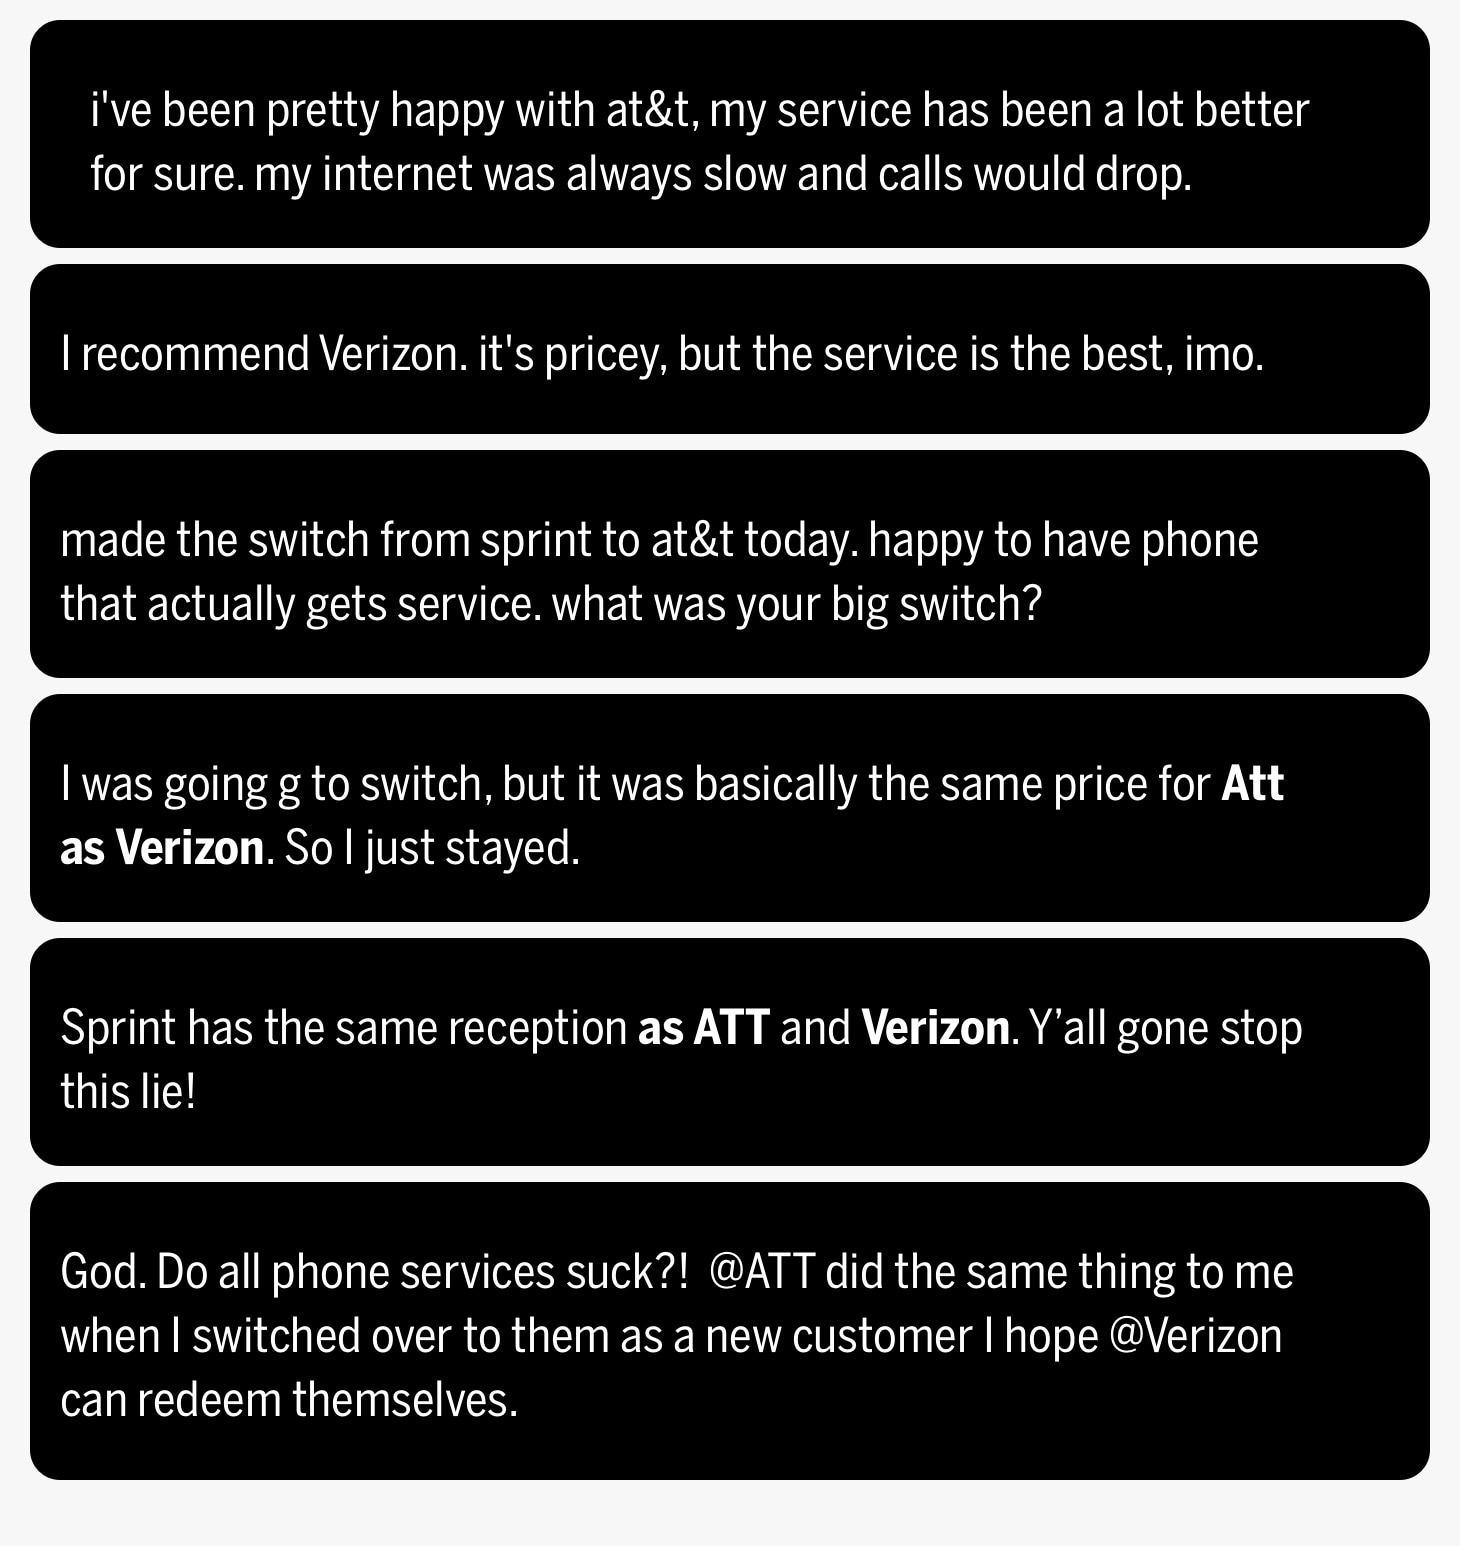
The third category of brands in the smartphone ecosystem falls into the access category. Comprising of AT&T, Verizon, T-Mobile, and Virgin, the access category provides service needed to connect the devices manufactured by the companies in the most intimate group in this ecosystem.
With our reliance on phone calls and texts, access brands provide an invaluable service. AT&T is the leading provider of mobile services in the US, with a market share of about 44.8% of wireless subscriptions in the third quarter of 2022, followed by Verizon and T-Mobile.6 The overall dominant archetype in this group is split, with half of the brands strongest in enhancement and the other being strongest in fulfillment. Although access is essential, it is likely seen as ubiquitous, and access brands can be seen more as commodities that enable the smartphone.
While the need to stay connected to others remains high, the way in which we make these connections is shifting. In recent years, more smartphone users are less likely to make/answer phone calls, especially those in younger age groups.7 With an affinity toward texting and social media messaging, phone calls are now becoming an increasingly dated form of communication.
Apps
The most saturated yet least intimate subgroup of the smartphone ecosystem is apps. With over 25 brands featured in this category, the group has an average Brand Intimacy Quotient of 31.40. Notably, the apps & social platforms industry also performed poorly in our annual study, ranking 15th overall out of 19 industries.
The number of mobile app downloads worldwide has increased continuously from 2016 onward, surpassing 200 billion in 2019. In 2022, consumers downloaded 255 billion mobile apps to their connected devices, up by more than 80% from 2016.8 As a result, global revenue from mobile apps increased to over 318 billion US dollars in 2020, marking an increase of over 60 billion US dollars compared to 2019. The strongest segment that year was the mobile games segment with a revenue of over 200 billion US dollars, followed by social networking mobile apps, which created a revenue of around 31 billion dollars.9
Overall, 72% of Americans say they use social media sites; however, this average shifts drastically when looking at specific age groups. For instance, while 65% of adults ages 18-29 say they use Snapchat, just 2% of those 65 and older report using the app—a difference of 63 percentage points.10
Unlike the other groups, the brands that make up this category vary wildly in form and function, making it difficult to identify any overall dominant archetype.
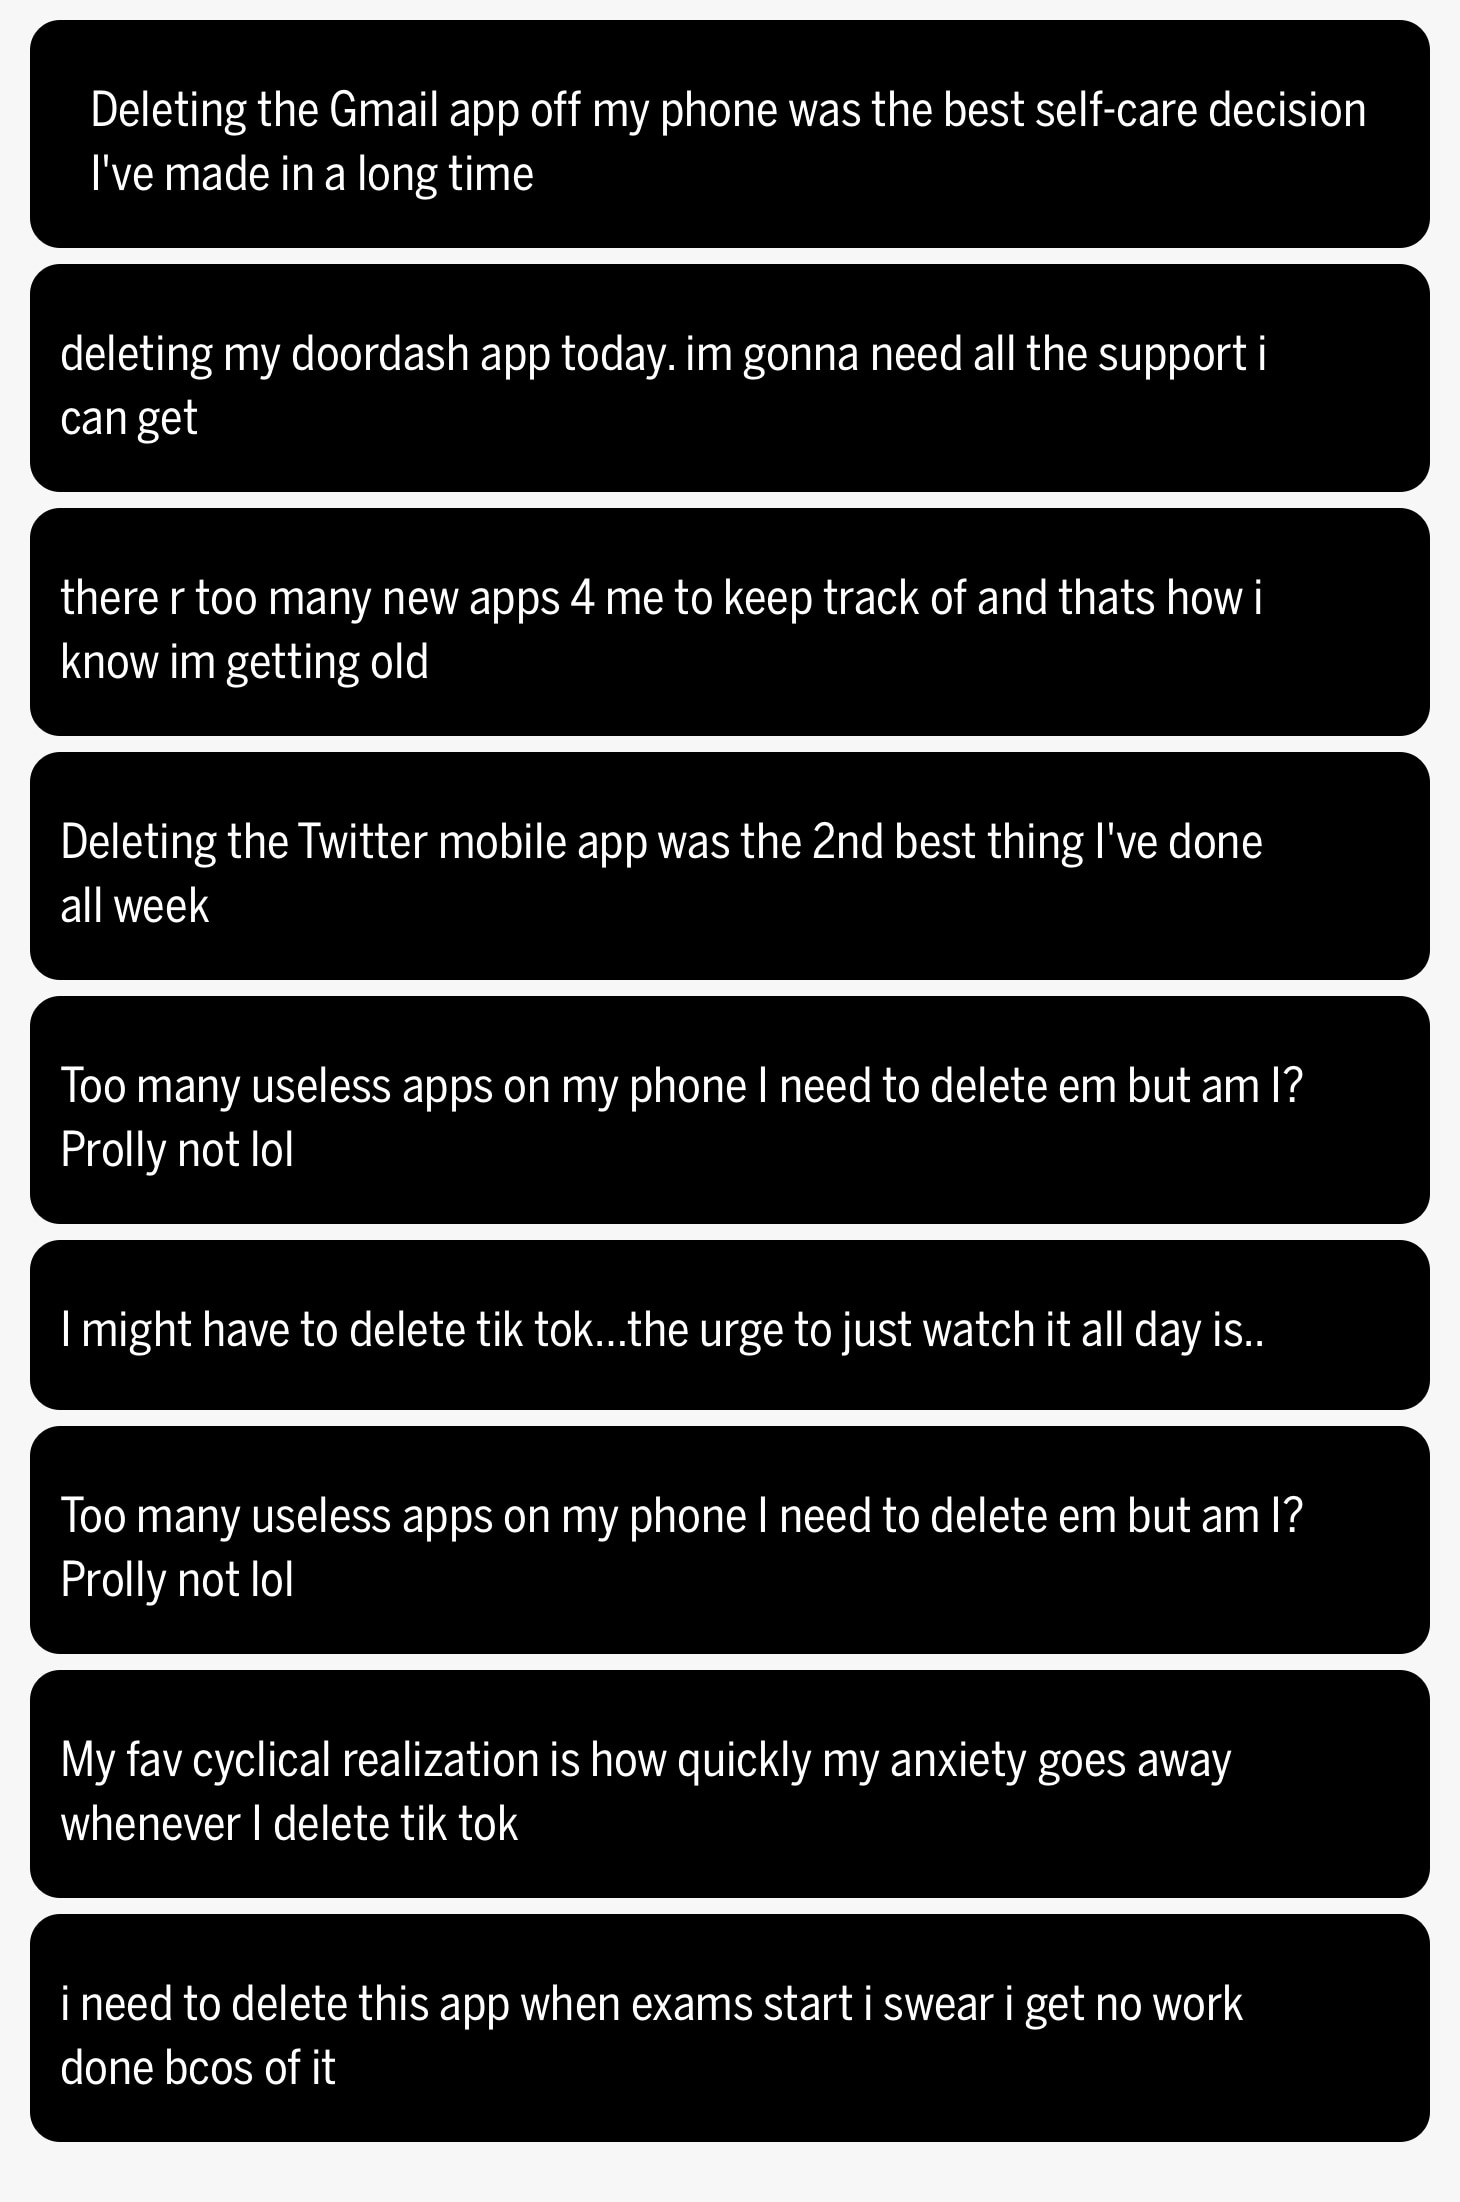
Relative to devices, apps struggle to obtain the level of dependence that their competitors have, because people are less dependent on their apps than they are on their physical devices. Statistically, 21% of apps are used only once during the first 6 months. Moreover, the global mobile app uninstall rate after 30 days is 28%, meaning almost 3 in every 10 apps will be deleted from users’ devices within a month.11
Conclusion
The smartphone ecosystem provides an interesting window into how some of the most powerful and relevant brands connect with consumers. Societal shifts in the ways we consume media and how we choose to communicate with each other further impact Brand Intimacy performance. The decline of the phone call and the struggle for apps to survive long term on devices, for instance, help us draw inferences on how this may affect future Brand Intimacy performance.
Heavy dependency on brands gives companies greater opportunities to build lasting intimacy with their consumers. The increase in smartphone addiction bolsters consumers’ likelihood to share, bond, and fuse with a brand. Examining dominant archetypes of brands in this ecosystem reveals that enhancement and fulfillment appear to be the most prevalent. Although the ritual archetype is underrepresented, it is interesting to note how we have incorporated many of the brands in this community into our daily lives and actions.
Moving forward, both consumers and brands may find it useful to reflect on how they participate in the smartphone ecosystem. Understanding the way we interact with our devices and media offers insight into why consumers value certain brands more than others and what influences these relationships.
Get an overview of Brand Intimacy here.
Read our detailed methodology here. Our Amazon best-selling book is available at all your favorite booksellers. To learn more about our Agency, Lab, and Platform, visit mblm.com.
Sources
1 “How many smartphones are in the world?” By bankmycell.com https://www.bankmycell.com/blog/how-many-phones-are-in-the-world
2 “Mobile Fact Sheet.” By pewresearch.org https://www.pewresearch.org/internet/fact-sheet/mobile/
3 “Our average screen time is now a whopping 4 – 6 hours per day (or 3 months per year)” By psychnewsdaily.com
Source no longer available
4 “More than eight-in-ten Americans get news from digital devices.” By pewresearch.org https://www.pewresearch.org/fact-tank/2021/01/12/more-than-eight-in-ten-americans-get-news-from-digital-devices/
5 “Streaming viewership overtakes cable TV for the first time.” By nbcnews.com https://www.nbcnews.com/business/consumer/streaming-viewership-overtakes-cable-tv-first-time-rcna43704
6 “Wireless subscriptions market share by carrier in the U.S. from 1st quarter 2011 to 3rd quarter 2022.” By statista.com https://www.statista.com/statistics/199359/market-share-of-wireless-carriers-in-the-us-by-subscriptions/
7 “Call declined: Why Gen Z won’t pick up the phone.” By smh.com.au https://www.smh.com.au/lifestyle/health-and-wellness/call-declined-why-gen-z-won-t-pick-up-the-phone-20220920-p5bjkf.html
8 “Number of mobile app downloads worldwide from 2016 to 2022.” By statista.com https://www.statista.com/statistics/271644/worldwide-free-and-paid-mobile-app-store-downloads/
9 “Revenue of mobile apps worldwide 2017-2025, by segment.” By statista.com https://www.statista.com/forecasts/1262892/mobile-app-revenue-worldwide-by-segment
10 “Social Media Use in 2021.” By pewresearch.org https://www.pewresearch.org/internet/2021/04/07/social-media-use-in-2021/
11 “New data shows uninstalls remain a significant pain for apps.” By appsflyer.com https://www.appsflyer.com/blog/trends-insights/app-uninstall-trends/