Overview
- The apps & social platforms industry ranks 15th in our 2022 Brand Intimacy Study.
- Twitter is the top-ranking apps & social platforms brand with a Quotient Score of 48.4.
- The apps & social platforms industry’s dominant archetype is enhancement.
Introduction
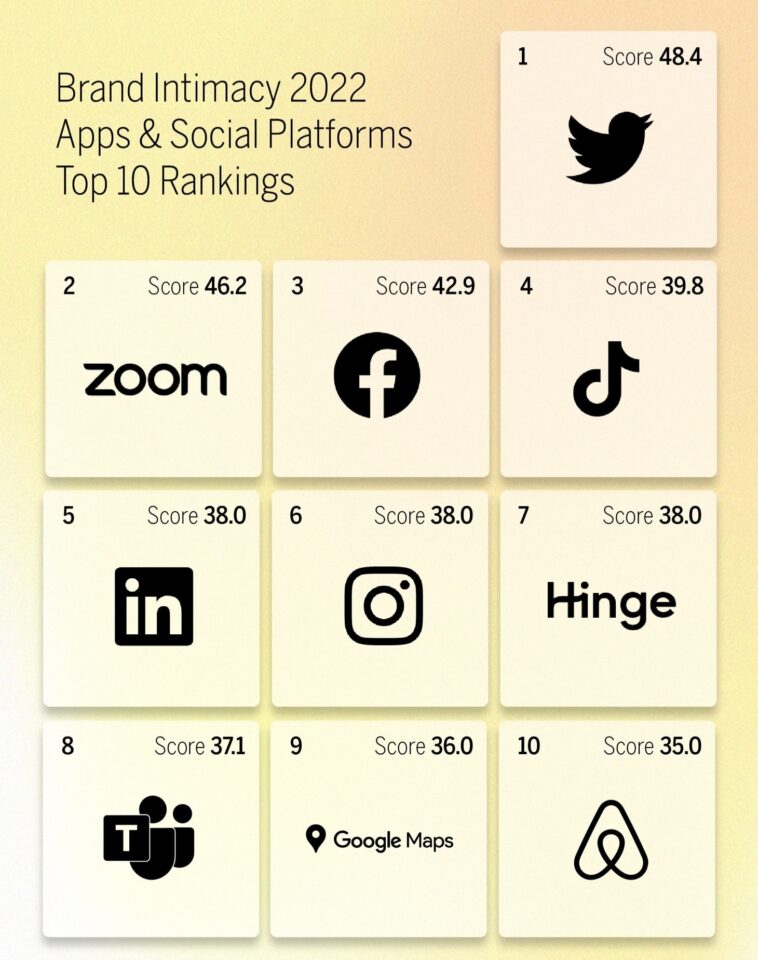
In this year’s Brand Intimacy Study, the apps & social platforms industry placed 15th with an average Brand Intimacy Quotient Score of 31.4, falling below the cross-industry average of 36.8. Despite the massive growth of the apps & social platforms industry over the past decade, it continues to perform poorly in our Brand Intimacy Study.
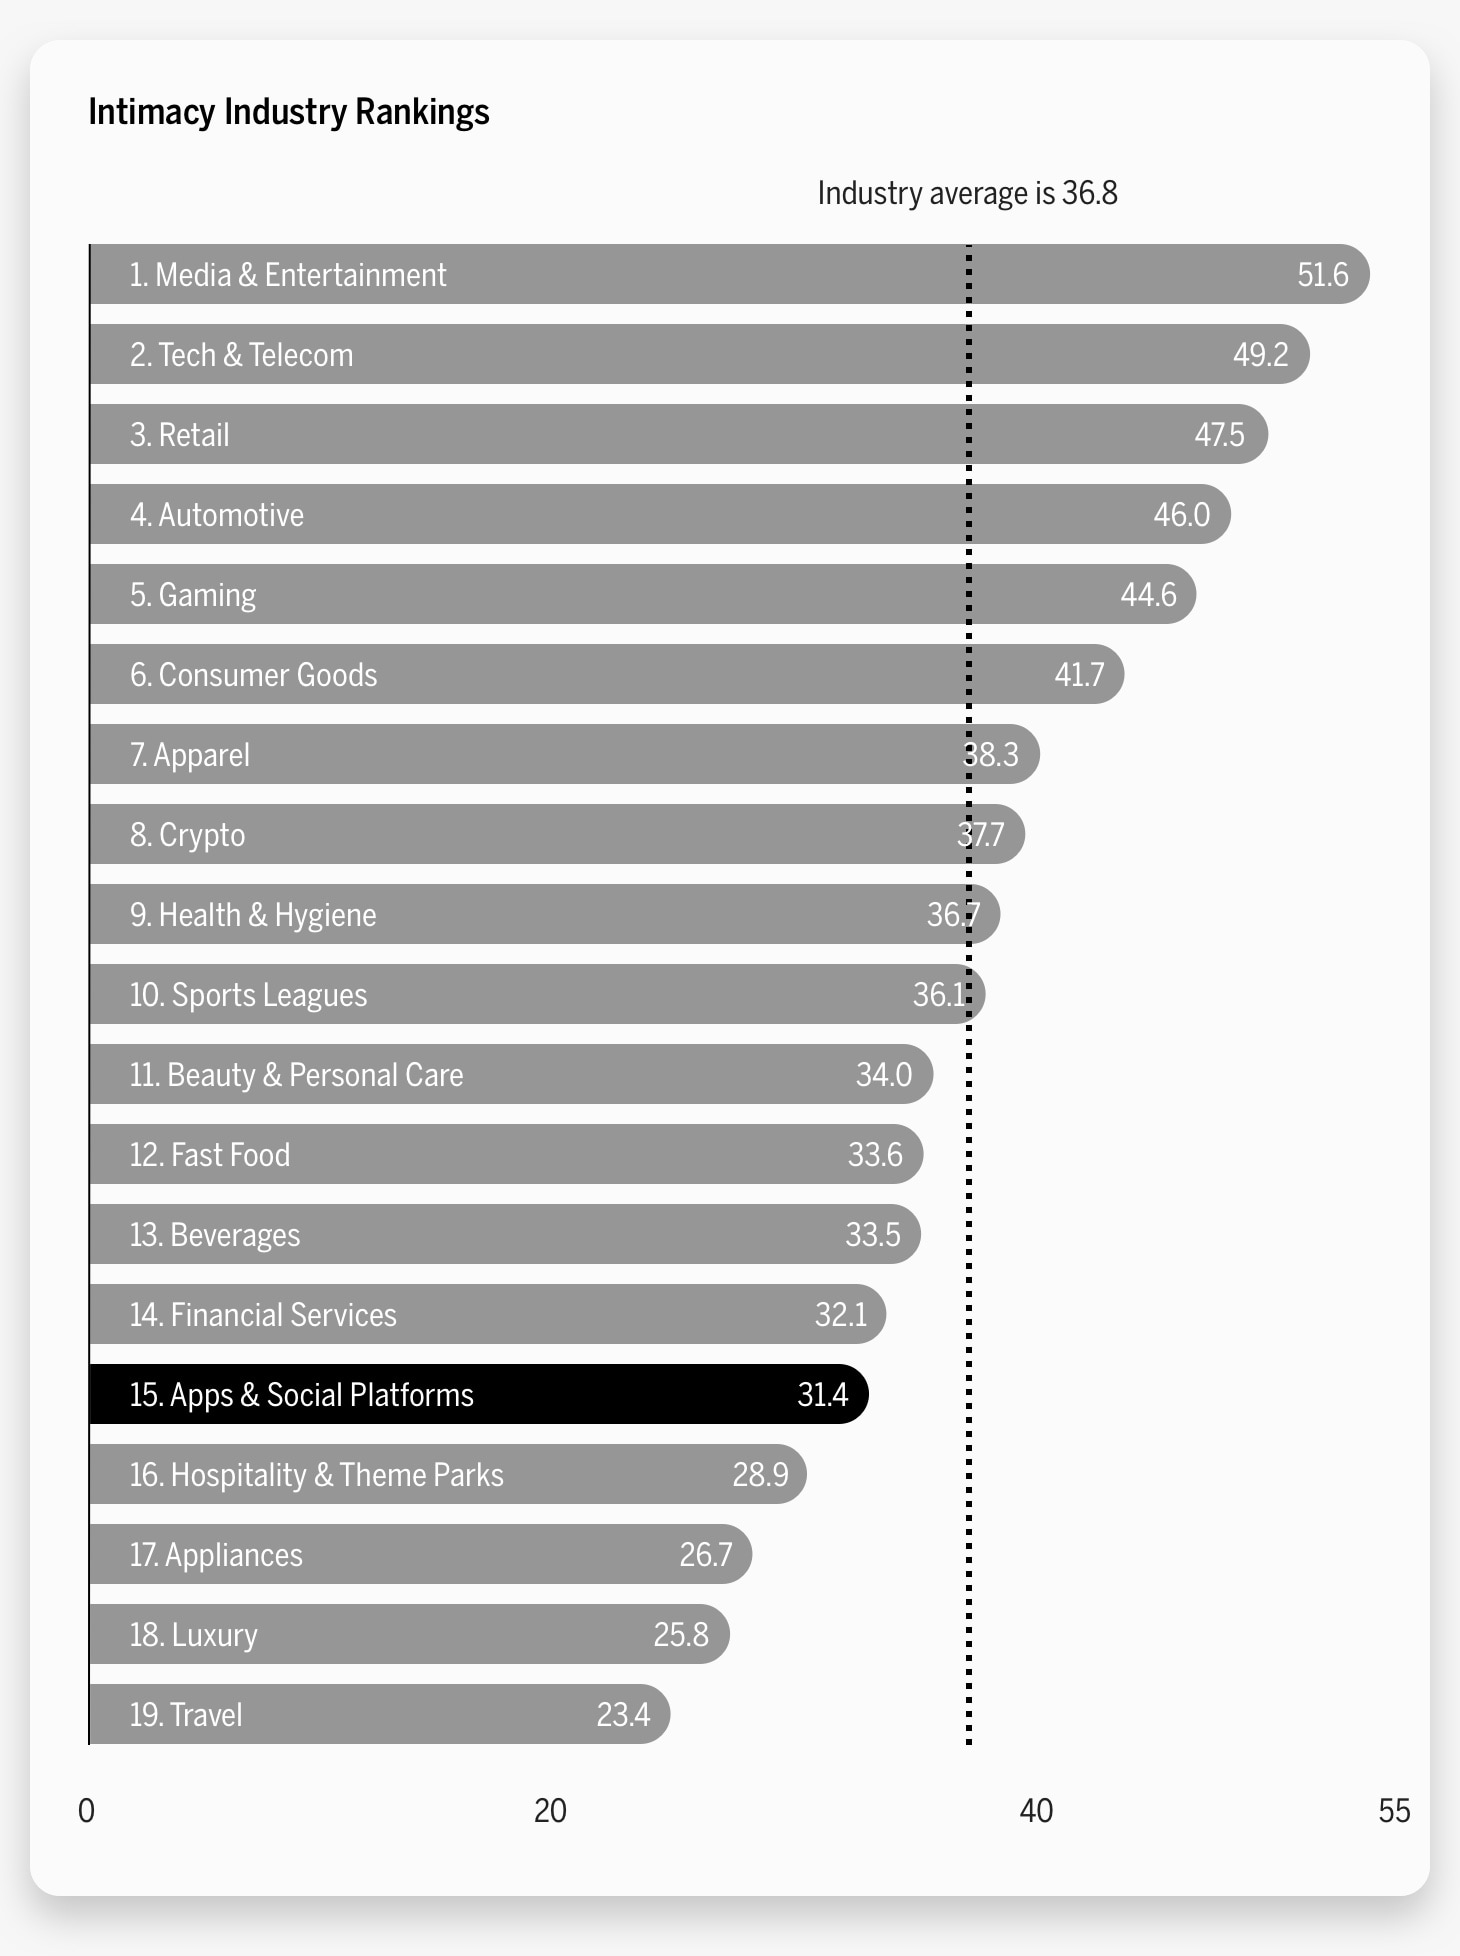
Spotify, last year’s top-performing brand in this industry, dropped to 13th place this year, while Twitter rose from 8th place to become the most intimate apps & social platforms brand of 2022. Facebook, which ranked 6th in 2021, now ranks just below Zoom as the 3rd most intimate apps & social platforms brand. The notable improvement of these two social media companies matches with the impacts of the Covid-19 pandemic1. Studies show that social media usage increased by 61% over the first wave of the pandemic. Another survey revealed that 30% of respondents were using social media one to two additional hours per day, and 21% of respondents used social media 30 minutes to one hour more than usual per day2. (To learn more about the effects of the pandemic on the apps & social platforms industry, read our previous article, Connecting to What Matters.)
Industry Overall
Apps & social platforms have cemented themselves in our daily lives. In 2021, 72% of US adults overall reported to be on at least one social media website3. This percentage increased as age decreased, as 84% of adults between ages 18 and 29 responded yes to the same question4. The power and prevalence of social media has situated companies like Facebook and Twitter as permanent fixtures in today’s society. Facebook, now run under its parent company Meta Platforms, is the most popular social media platform in the world with almost 3 billion monthly active users,5 as compared to Twitter’s roughly 450 million monthly active users.6
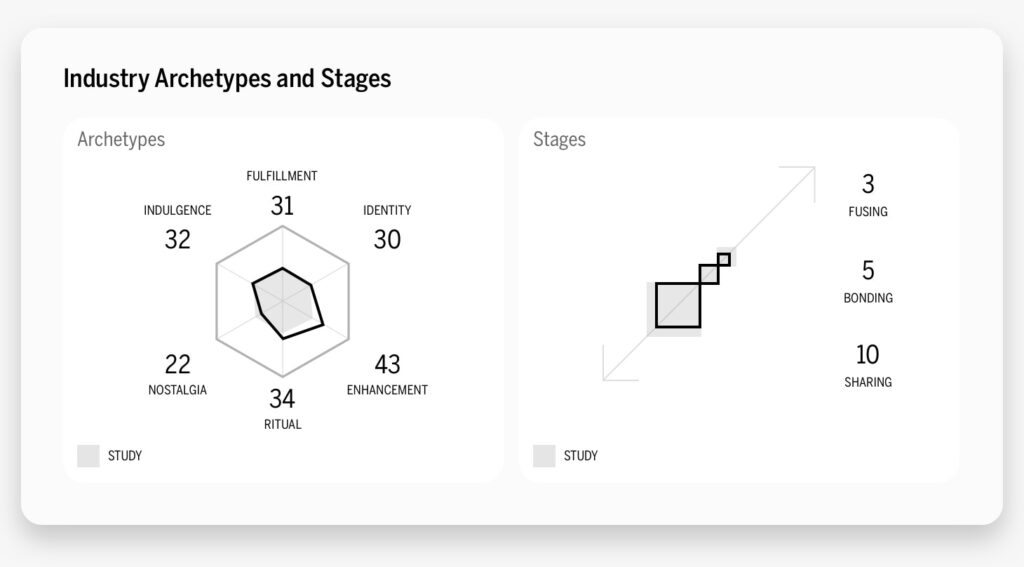
Enhancement, which centers on customers becoming better through use of the brand—smarter, more capable, and more connected—is the industry’s dominant archetype, followed by ritual. The industry ranks second out of 19 industries for enhancement and fourth for ritual. Furthermore, of the 17% of apps & social platform users who are in some stage of intimacy with brands in the industry, 10% are in the sharing stage, the earliest stage of intimacy; 5% are in bonding, the middle stage; and 3% are in fusing, the most advanced stage. These scores are all below the cross-industry average and suggest the category is still struggling to form emotional connections with consumers.
The convenience and breadth the social platforms offer seems to drive the appeal of using apps like Facebook and Twitter. The ability to connect, chat, and keep up with people from around the world is a relatively new phenomena and creates, in a way, a new kind of intimacy between people. Brands in this space often help open new channels of communication and windows of opportunity. Thus, it is not surprising to see enhancement come out as the dominant archetype for this industry. Similarly, the strength of the ritual archetype speaks to how embedded these brands have become in our daily lives and routines. The dependency users have on the way these companies improve their lives creates a strong bond and daily reliance on the services they provide.
However, the evolution of these platforms, most of which are over 10 years old, is accompanied by a change in their user demographics and public perception. Massive scandal, heavy political influence, and the spread of propaganda and disinformation have all contributed to extreme polarization among communities online and offline. These changes, like the ones seen in Facebook and Twitter, offer further insight into what differentiates each company and why Twitter is more successful in building brand intimacy.
Founded in 2006, Twitter created a new way for users to connect and communicate with others through “tweets.” Today, the platform initially created by a group of young entrepreneurs has grown into a tech giant boasting over 237 million monetizable daily active users (often shortened to mDAUs). Twitter first went public in September 2013, where its initial public offering raised $1.8 billion, giving it a market value of $31 billion at the time.7 Today, Twitter has a market cap of about $32.69 billion, making Twitter the 470th most valuable company by market cap.8
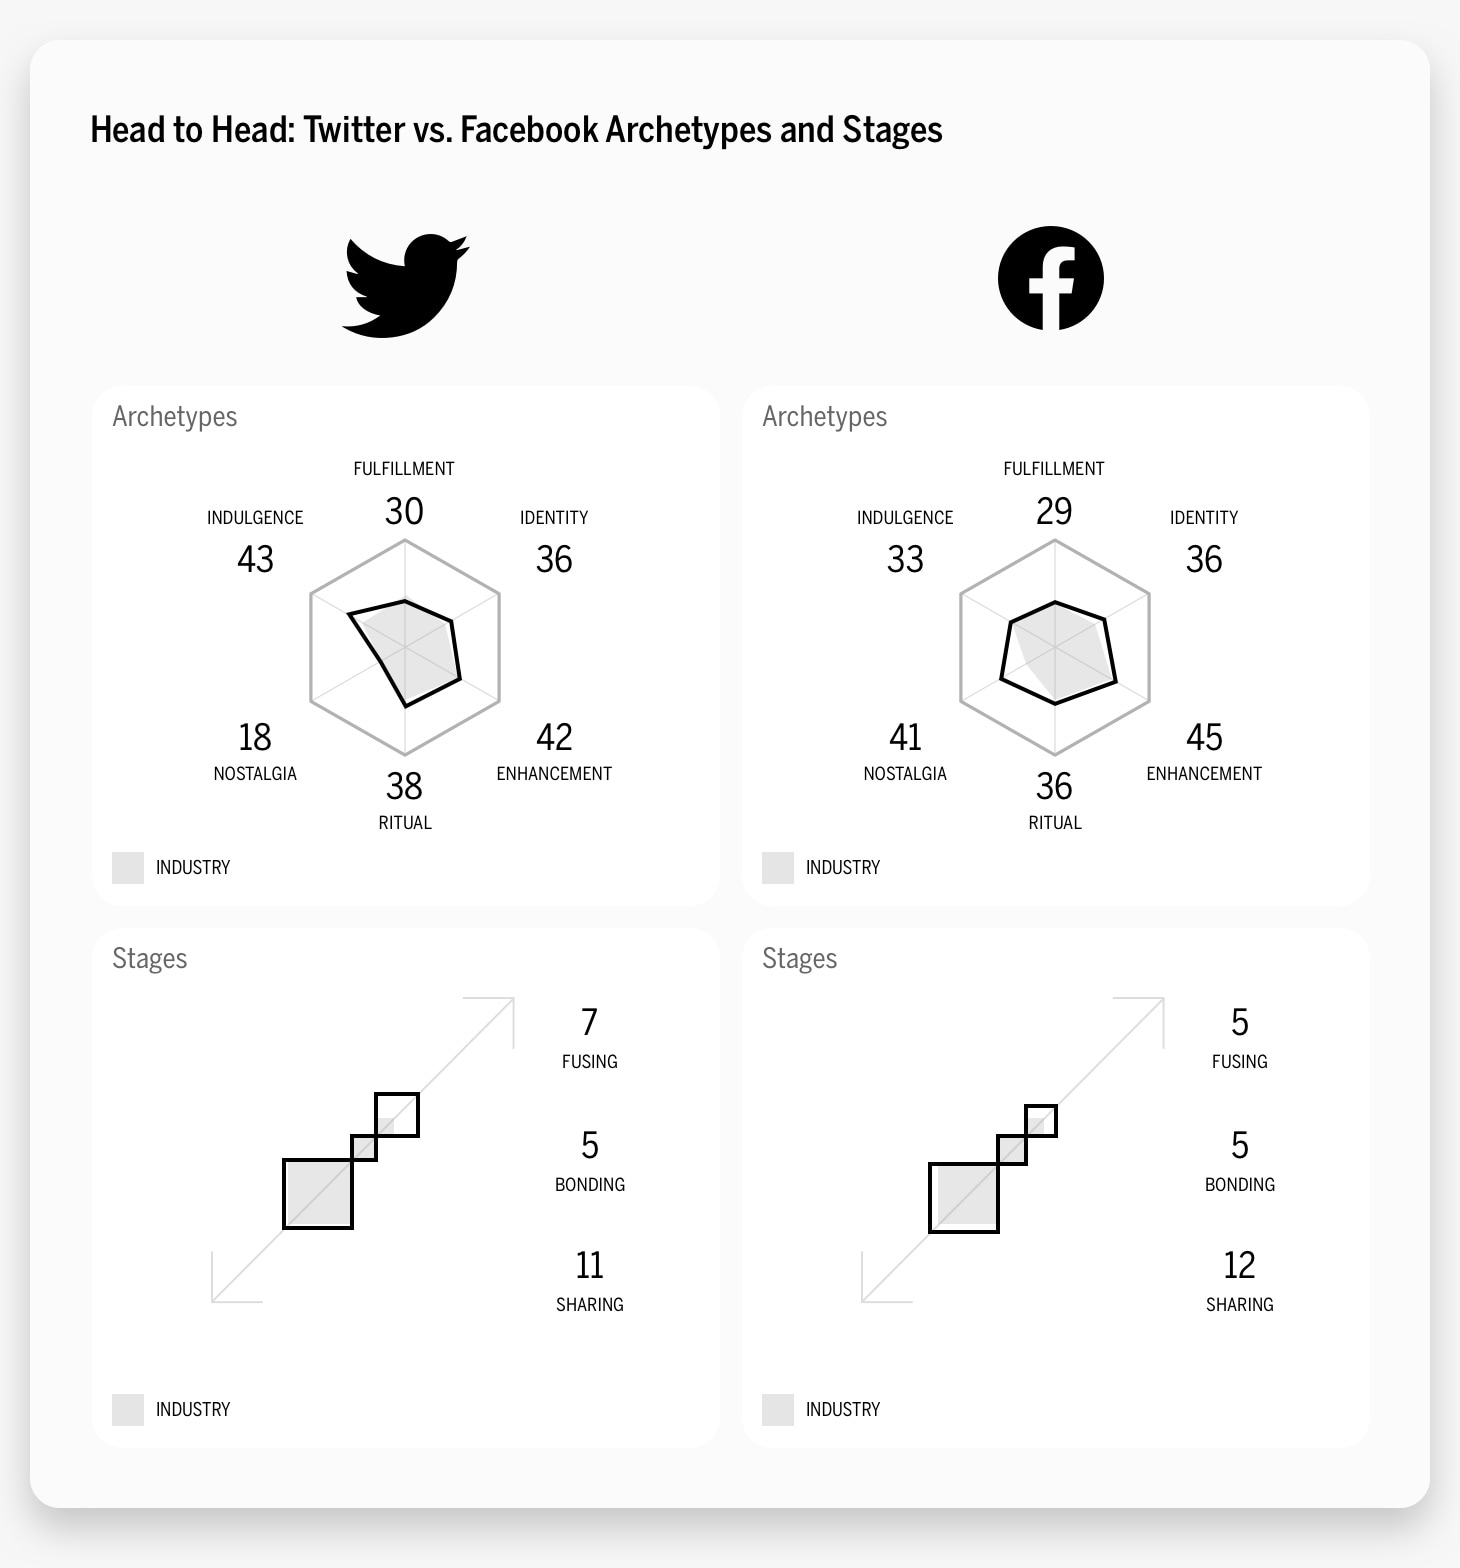
Unlike the industry overall, Twitter’s dominant archetype is indulgence, which focuses on brands creating a close relationship centered on moments of pampering and gratification that can be occasional or frequent. Keywords for Twitter include “entertainment,” “togetherness,” and “friendship.” Twitter’s notable divergence from the brand’s dominant archetype distinguishes itself from competing companies like Facebook, which ranked 3rd in this year’s study, and LinkedIn, which ranked 5th. This indicates that Twitter users regard their presence on the platform not only as a way to enhance their lives, but also as a fun and enjoyable experience.
Moreover, Twitter has 11% of users in the sharing stage, 5% in bonding, and 7% in fusing, the most advanced stage of brand intimacy. Compared to the industry overall, Twitter performs better in the sharing and fusing stages. Of the consumers who write about Twitter, 23.4% are in some form of intimacy with the brand; this is almost double the industry average. With a Quotient Score of 48.4, Twitter ranks 54th in our overall Brand Intimacy Study.
Twitter, like many of its tech contemporaries, has not gone without some scandals accompanying its growth and expansion. The social networking service’s most recent controversy concerns a recent buyout agreement. In early 2022, Elon Musk, the billionaire founder and CEO of Tesla and SpaceX, made a $44 billion offer to purchase Twitter, which was then accepted by the board of directors in April. This deal, had it gone through, would have been one of the biggest deals ever to turn a public company private. However, Musk attempted to terminate the deal in July, claiming the company had not properly accounted for the number of fake accounts on the platform. Consequently, Twitter and Musk became involved in a lawsuit over Musk’s abandonment of the deal9 until Musk revived his bid for the platform in early October.10 Musk’s announcement that he would allow former President Donald Trump back on Twitter after being permanently banned by the platform in January 2021 because of the “risk of further incitement of violence” has garnered harsh criticism.11
Facebook (Meta)
There is perhaps no social media platform more famous and infamous than Facebook. From its disputed beginnings12 to its role in the spread of misinformation,13 Facebook is no stranger to headlines, lawsuits, or congressional hearings.
Facebook originated as the brainchild of Mark Zuckerberg and a small team of students at Harvard University in 2004. Now, almost 20 years later, Facebook is the largest and most popular social media platform in the world with nearly 3 billion monthly users14 and is one of the most valuable companies ever.15 In October 2021, the company changed its parent company name from Facebook, Inc., to Meta Platforms, to signify its shift in focus to development in the metaverse.
This year, Facebook ranked 3rd overall, falling just below Zoom and moving up from its 6th place ranking in last year’s Brand Intimacy Study. Like the overall industry, Facebook’s dominant archetype is enhancement, which is when customers become better through use of the brand—smarter, more capable, and more connected. Facebook has 12% of its users in the sharing stage; 5% in bonding; and 5% in fusion, the most advanced stage of brand intimacy, outperforming the industry in sharing and fusion. Of the consumers who write about Facebook, 21.4% are in some form of intimacy with the brand. Finally, with a Quotient Score of 42.9, the brand ranks 119th overall in our 2022 Brand Intimacy Study.
The strongest keyword for Facebook is “connection,” signaling a different user perspective on the function of the social media site as compared to Twitter.
Differing Perspectives
By examining over 1.4 billion words and phrases from social media, our 2022 Brand Intimacy Study provides valuable insights into how consumers feel about brands.
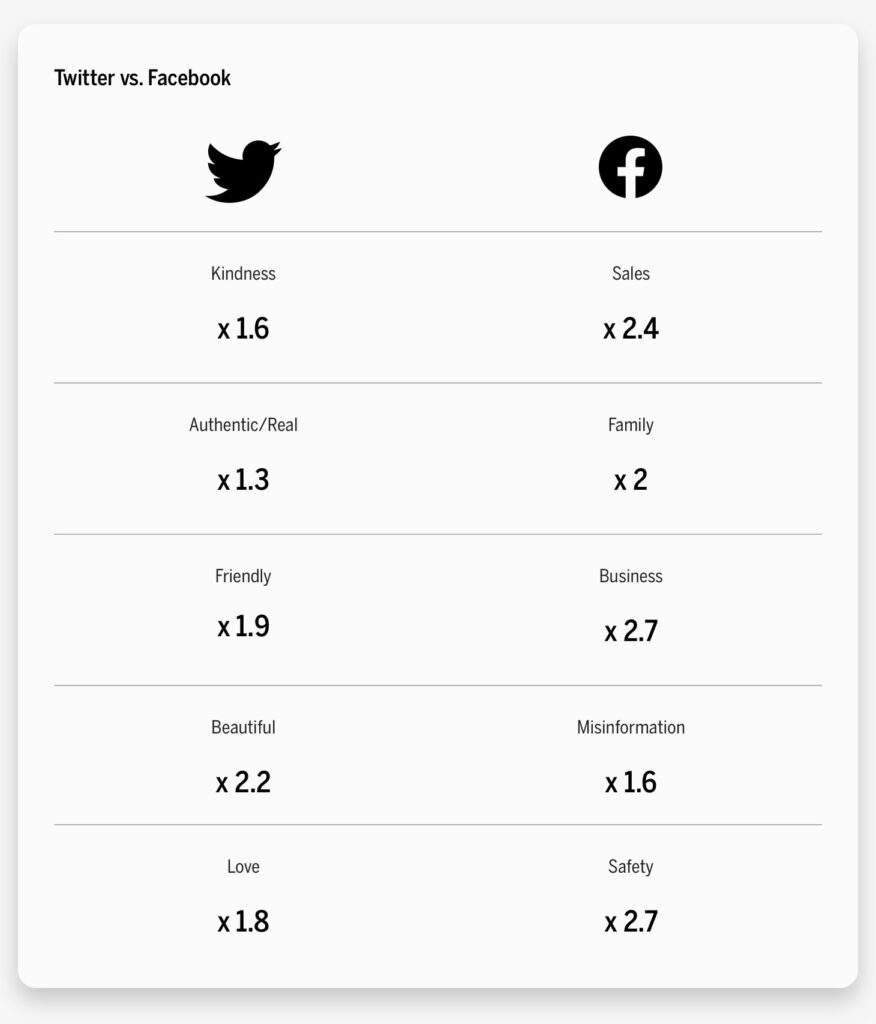
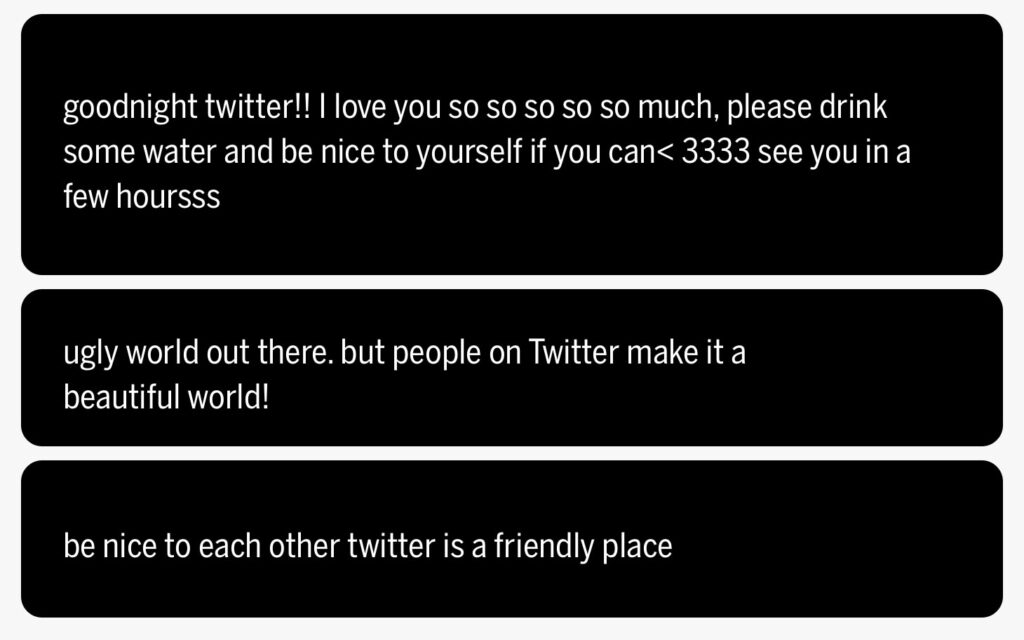
Online discourse discussing Twitter and Facebook both against competitors and each other reveal similar trends and themes. On the whole, users who write about Twitter tend to speak more to the positive community and generally friendly attitude of active individuals on the platform.
In contrast, discourse surrounding Facebook was more business oriented and revealed greater concern for privacy and disinformation.
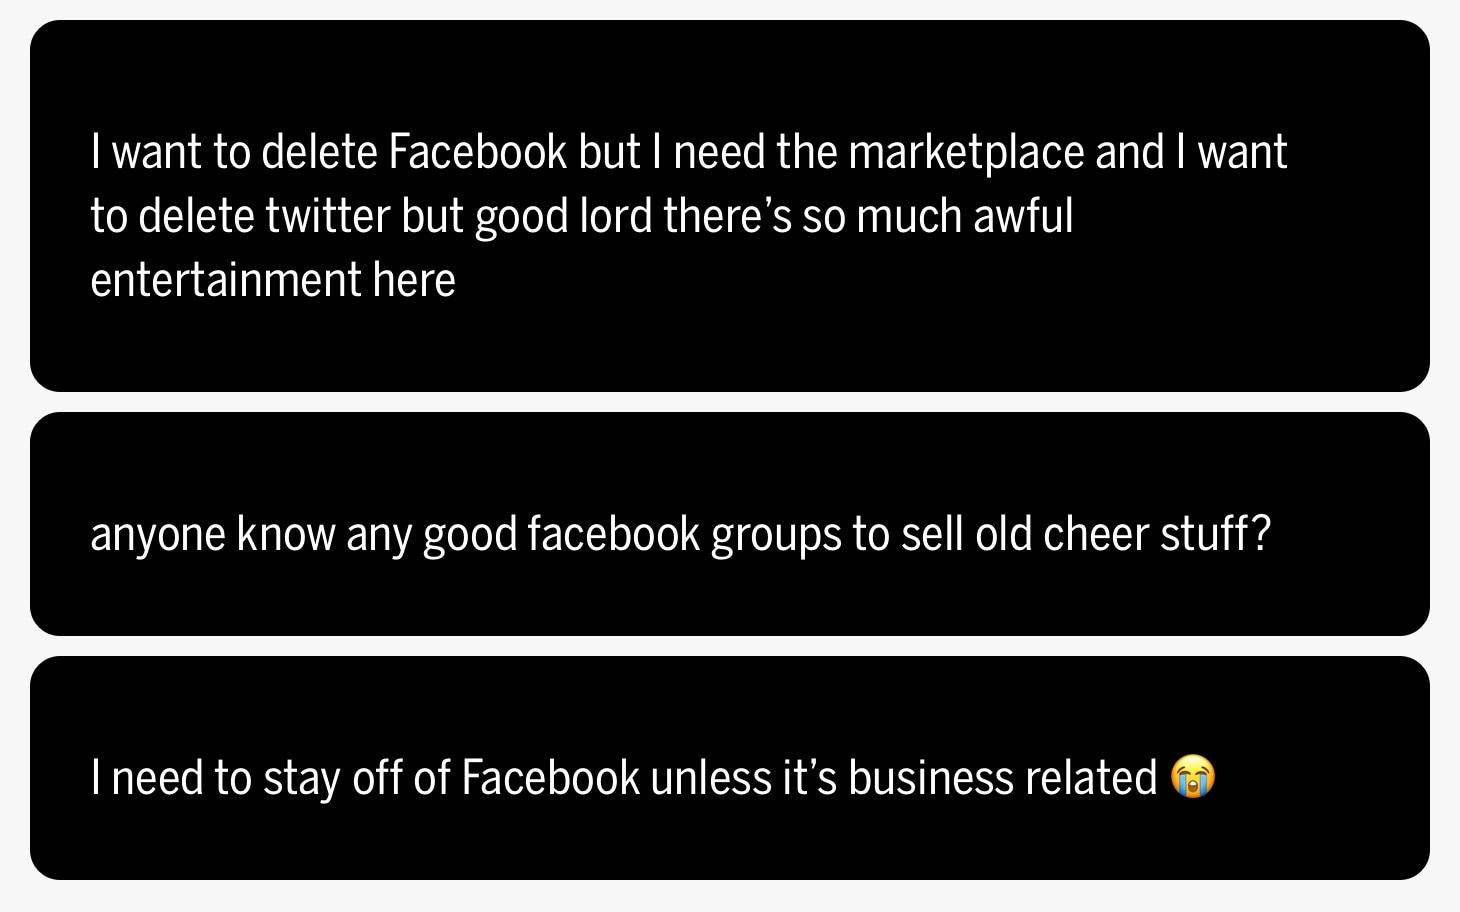
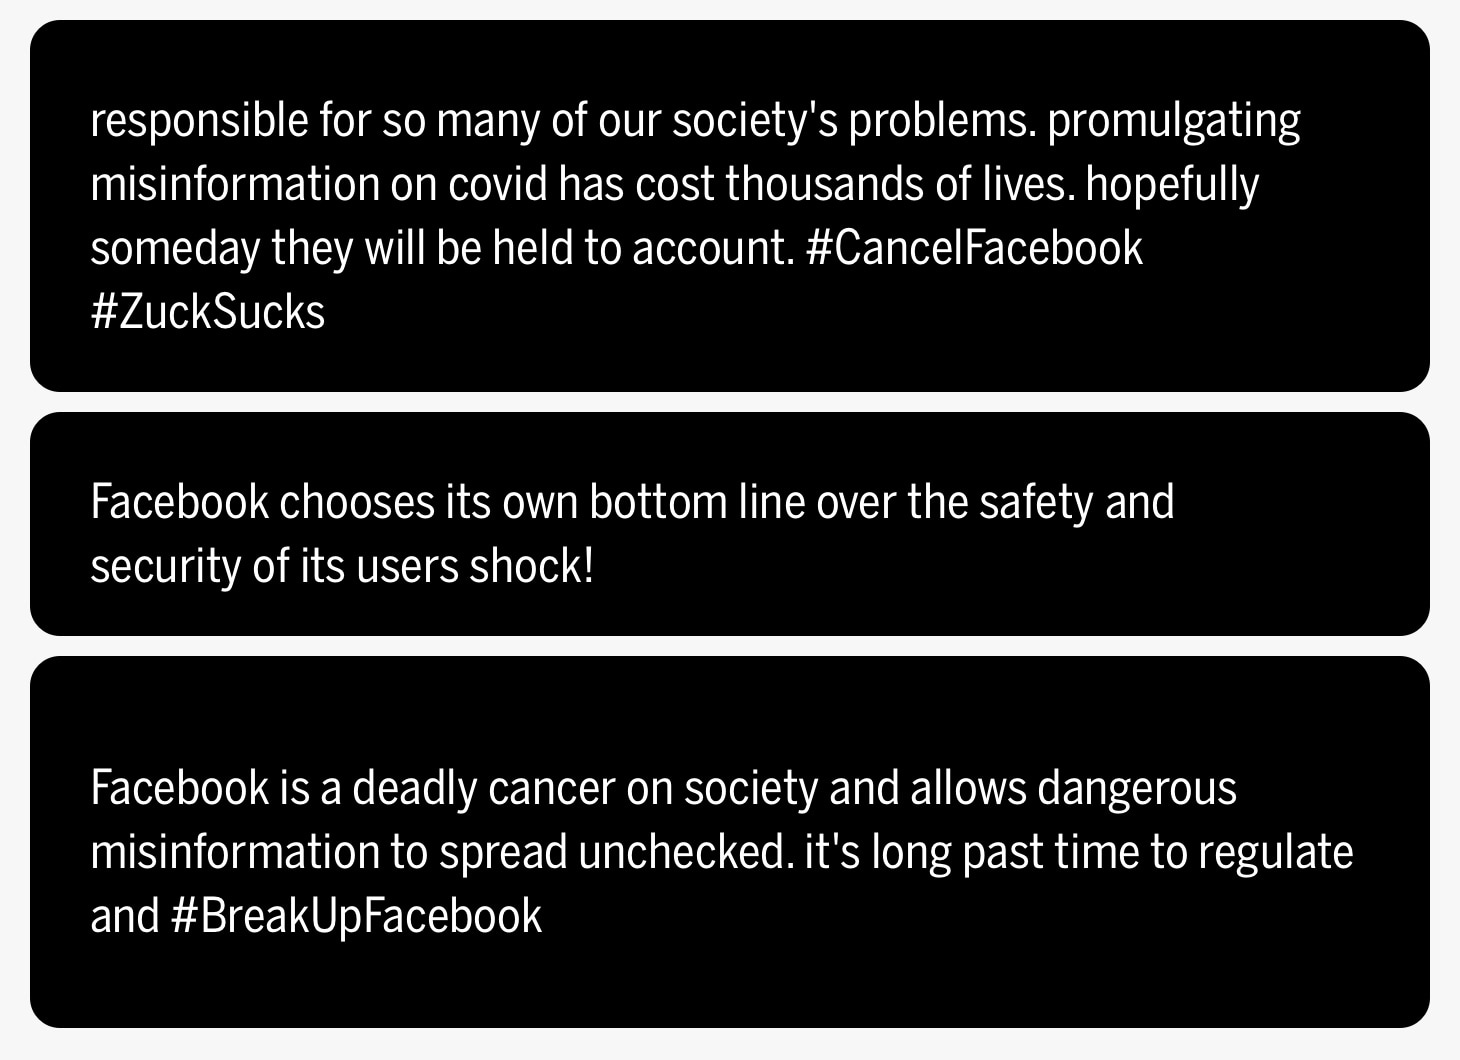
These speak to the different communities and functions of either platform. Facebook’s “business page” and “marketplace” features lend it to be used in a different way than Twitter, which does not have either of these features. Although Facebook can be efficiently utilized as a tool to buy and sell things as well as grow a business, Twitter is more community based and facilitates conversations and interactions between individuals (whether positive or negative).
Different Demographics
The strength of Twitter in this year’s Brand Intimacy Study, as well as its distinctive associations may be partially a result of its demographics. A recent study from the Pew Research Center revealed that Twitter users are younger, more likely to identify as democrats, more highly educated and have higher incomes that US adults overall. Specifically, 73% of Twitter users are likely to be younger than 50, with 29% of users falling between the ages of 18-29 and 44% falling between the ages of 30-49.
Facebook, on the other hand, has seen a growth in older users over the past few years. A recent Gallup poll indicated that 52% of people ages 50 to 64 have a Facebook page, an 18% increase since 2011. Similarly, Facebook use among people 65 and older has risen from 18% to 32%, a 14% jump. Research further showed that the growth of Facebook by younger users has slowed as many users favor Snapchat and Twitter.
In recognizing these changing numbers, Facebook data scientists put together a presentation to better understand these shifts. The internal report, which was later obtained by The Verge, explained, “Most young adults perceive Facebook as a place for people in their 40s and 50s.” The scientists also suggested that young adults perceived Facebook content as boring, misleading, and negative.
Facebook is particularly notorious for its role in spreading propaganda, misinformation, and selling users’ personal data, most famously during the 2016 election. More recently, Facebook groups buzzed with over 650,000 posts denying and spreading conspiracy theories regarding the legitimacy of Joe Biden’s win in the 2020 Presidential Election, ultimately resulting in the January 6th attack on the United States Capitol. Data like this aligns with the idea that Facebook users might exist in more politically aggressive, “mature” communities than they do on Twitter. Rather than an indulgence, using Facebook may be viewed as a headache for younger users.
Twitter, comparatively, is not at all absent of misinformation and negative posts. A recent study revealed that not only does fake news spreads faster than true news on Twitter, but tweets containing falsehoods were 70% more likely to be retweeted than truthful tweets. To combat this spread, Twitter began labeling tweets that did not meet the threshold for removal to inform and contextualize possible false claims. However, Twitter’s size and number of monthly users still pales in comparison to that of Facebook’s, giving it far less relative power and reach.
Conclusion
This year, Twitter’s dominance in the apps & social platforms industry points towards the value of not only enhancing users’ lives but also indulging them. Social listening suggests that different kinds of users interact differently with these two platforms, Twitter users speak of the platform as being more friendly and kind, while Facebook users focus more on the business features and security concerns. Although both Facebook and Twitter (along with many other apps & social platforms) make connecting with others easier and faster, not all of these platforms exist without significant consequence or impact on their users and their communities.
In response to growing concerns about the role of sites like Facebook and Twitter in spreading misinformation, the companies have attempted to do better. Concerns about Covid-19 and vaccination disinformation led to Meta’s announcement that it will “take action against vaccine misinformation superspreaders,” although many say it is not doing enough.
Apps & social platforms have proven to be powerful in ways far greater than their original intended use. Today, about 59% of the world’s population uses social media with an average daily usage of 2 hours and 29 minutes. As these individual platforms continue to adapt and expand, so must their users to match with the values of their distinctive communities.
However, despite gaining popularity, apps & social platforms still need to do better in connecting both their users to each other and their brand to their users. The industry’s overall poor performance in this year’s study shows there is major room for improvement in building stronger emotional bonds with consumers. This aligns with our Brand Intimacy Study 2022 Report, which showed that within the smartphone ecosystem, apps have historically been the least intimate brands. Earning user trust by respecting widespread security and privacy concerns would likely help bolster overall public perception of and intimacy within industry.
Get an overview of Brand Intimacy here.
Read our detailed methodology here. Our Amazon best-selling book is available at all your favorite booksellers. To learn more about our Agency, Lab, and Platform, visit mblm.com.
Sources
1 “Instagram vs. Reality: The Pandemic’s Impact on Social Media and Mental Health.” By Pennmedicine.org https://www.pennmedicine.org/news/news-blog/2021/april/instagram-vs-reality-the-pandemics-impact-on-social-media-and-mental-health
2 “Additional daily time spent on social media platforms by users in the United States due to coronavirus pandemic as of March 2020.” By Statista.com https://www.statista.com/statistics/1116148/more-time-spent-social-media-platforms-users-usa-coronavirus/
3 “Social Media Fact Sheet.” By pewresearch.org https://www.pewresearch.org/internet/fact-sheet/social-media/
4 Ibid
5 “Number of monthly active Facebook users worldwide.” By statista.com https://www.statista.com/statistics/264810/number-of-monthly-active-facebook-users-worldwide/
6 “Twitter Revenue and Usage Statistics.” By businessofapps.com https://www.businessofapps.com/data/twitter-statistics/
7 “Twitter.” By Britannica.com https://www.britannica.com/topic/Twitter
8 “Market capitalization of Twitter.” By companiesmarketcap.com https://companiesmarketcap.com/twitter/marketcap
9 “Elon Musk wants to get out of buying Twitter. A whistleblower’s claims might help him.” By npr.org https://www.npr.org/2022/09/03/1120867467/elon-musk-twitter-whistleblower#:~:text=The%20Tesla%20CEO%20now%20argues,the%20company%20for%20%2444%20billion
10 “Elon Musk may soon own Twitter. What might it look like when he does?” By washingtonpost.com https://www.washingtonpost.com/technology/2022/10/05/twitter-elon-musk-future-trump/
11 “Elon Musk says he would allow Donald Trump back on Twitter.” By cbsnews.com https://www.cbsnews.com/news/elon-musk-donald-trump-twitter-allow/
12 Facebook’s complicated ownership history explained.” By smh.com https://www.smh.com.au/technology/facebooks-complicated-ownership-history-explained-20110415-1dgi5.html
13 “Facebook Misinformation NYU Study.” By washingtonpost.com https://www.washingtonpost.com/technology/2021/09/03/facebook-misinformation-nyu-study/
14 “The Eight Top Social Media Sites you should Prioritize.” By Adobe.com https://www.adobe.com/express/learn/blog/top-social-media-sites#:~:text=3.-,Facebook,media%20platform%20in%20the%20world
15 “Biggest companies in the world by market cap.” By Investopedia.com https://www.investopedia.com/biggest-companies-in-the-world-by-market-cap-5212784
16 “Sizing up Twitter Users.” By pewresearch.org https://www.pewresearch.org/internet/2019/04/24/sizing-up-twitter-users/
17 “Older Adults’ Use of Facebook Continues to Grow.” By aarp.org https://www.aarp.org/home-family/personal-technology/info-2018/facebook-older-americans-privacy.html#:~:text=The%20poll%20of%201%2C509%20U.S.,a%2014%20percentage%20point%20jump
18 Ibid
19 “Facebook’s Lost Generation.” By theverge.com https://www.theverge.com/22743744/facebook-teen-usage-decline-frances-haugen-leaks
20 Ibid.
21 “Fake news spreads faster than true news on Twitter—thanks to people, not bots.” By science.org https://www.science.org/content/article/fake-news-spreads-faster-true-news-twitter-thanks-people-not-bots
22 “How we address misinformation on Twitter.” By twitter.com https://help.twitter.com/en/resources/addressing-misleading-info
23 “How We’re Taking Action Against Vaccine Misinformation Superspreaders.” By Meta.com https://about.fb.com/news/2021/08/taking-action-against-vaccine-misinformation-superspreaders/
24 “Our compilation of the latest social media statistics of consumer adoption and usage of social networking platforms.” By smartinsights.com https://www.smartinsights.com/social-media-marketing/social-media-strategy/new-global-social-media-research/
