DASHBOARD
A suite of web tools that allow users to do more with UL
Challenge
The UL online experience we found in 2009 was severely fractured, and the infrastructure antiquated. As part of a multiyear strategy and redevelopment of the site, our teams began by creating a high-level digital strategy. This formed the overarching blueprint that drove all technology, design and content choices for UL.com and other digital channels.
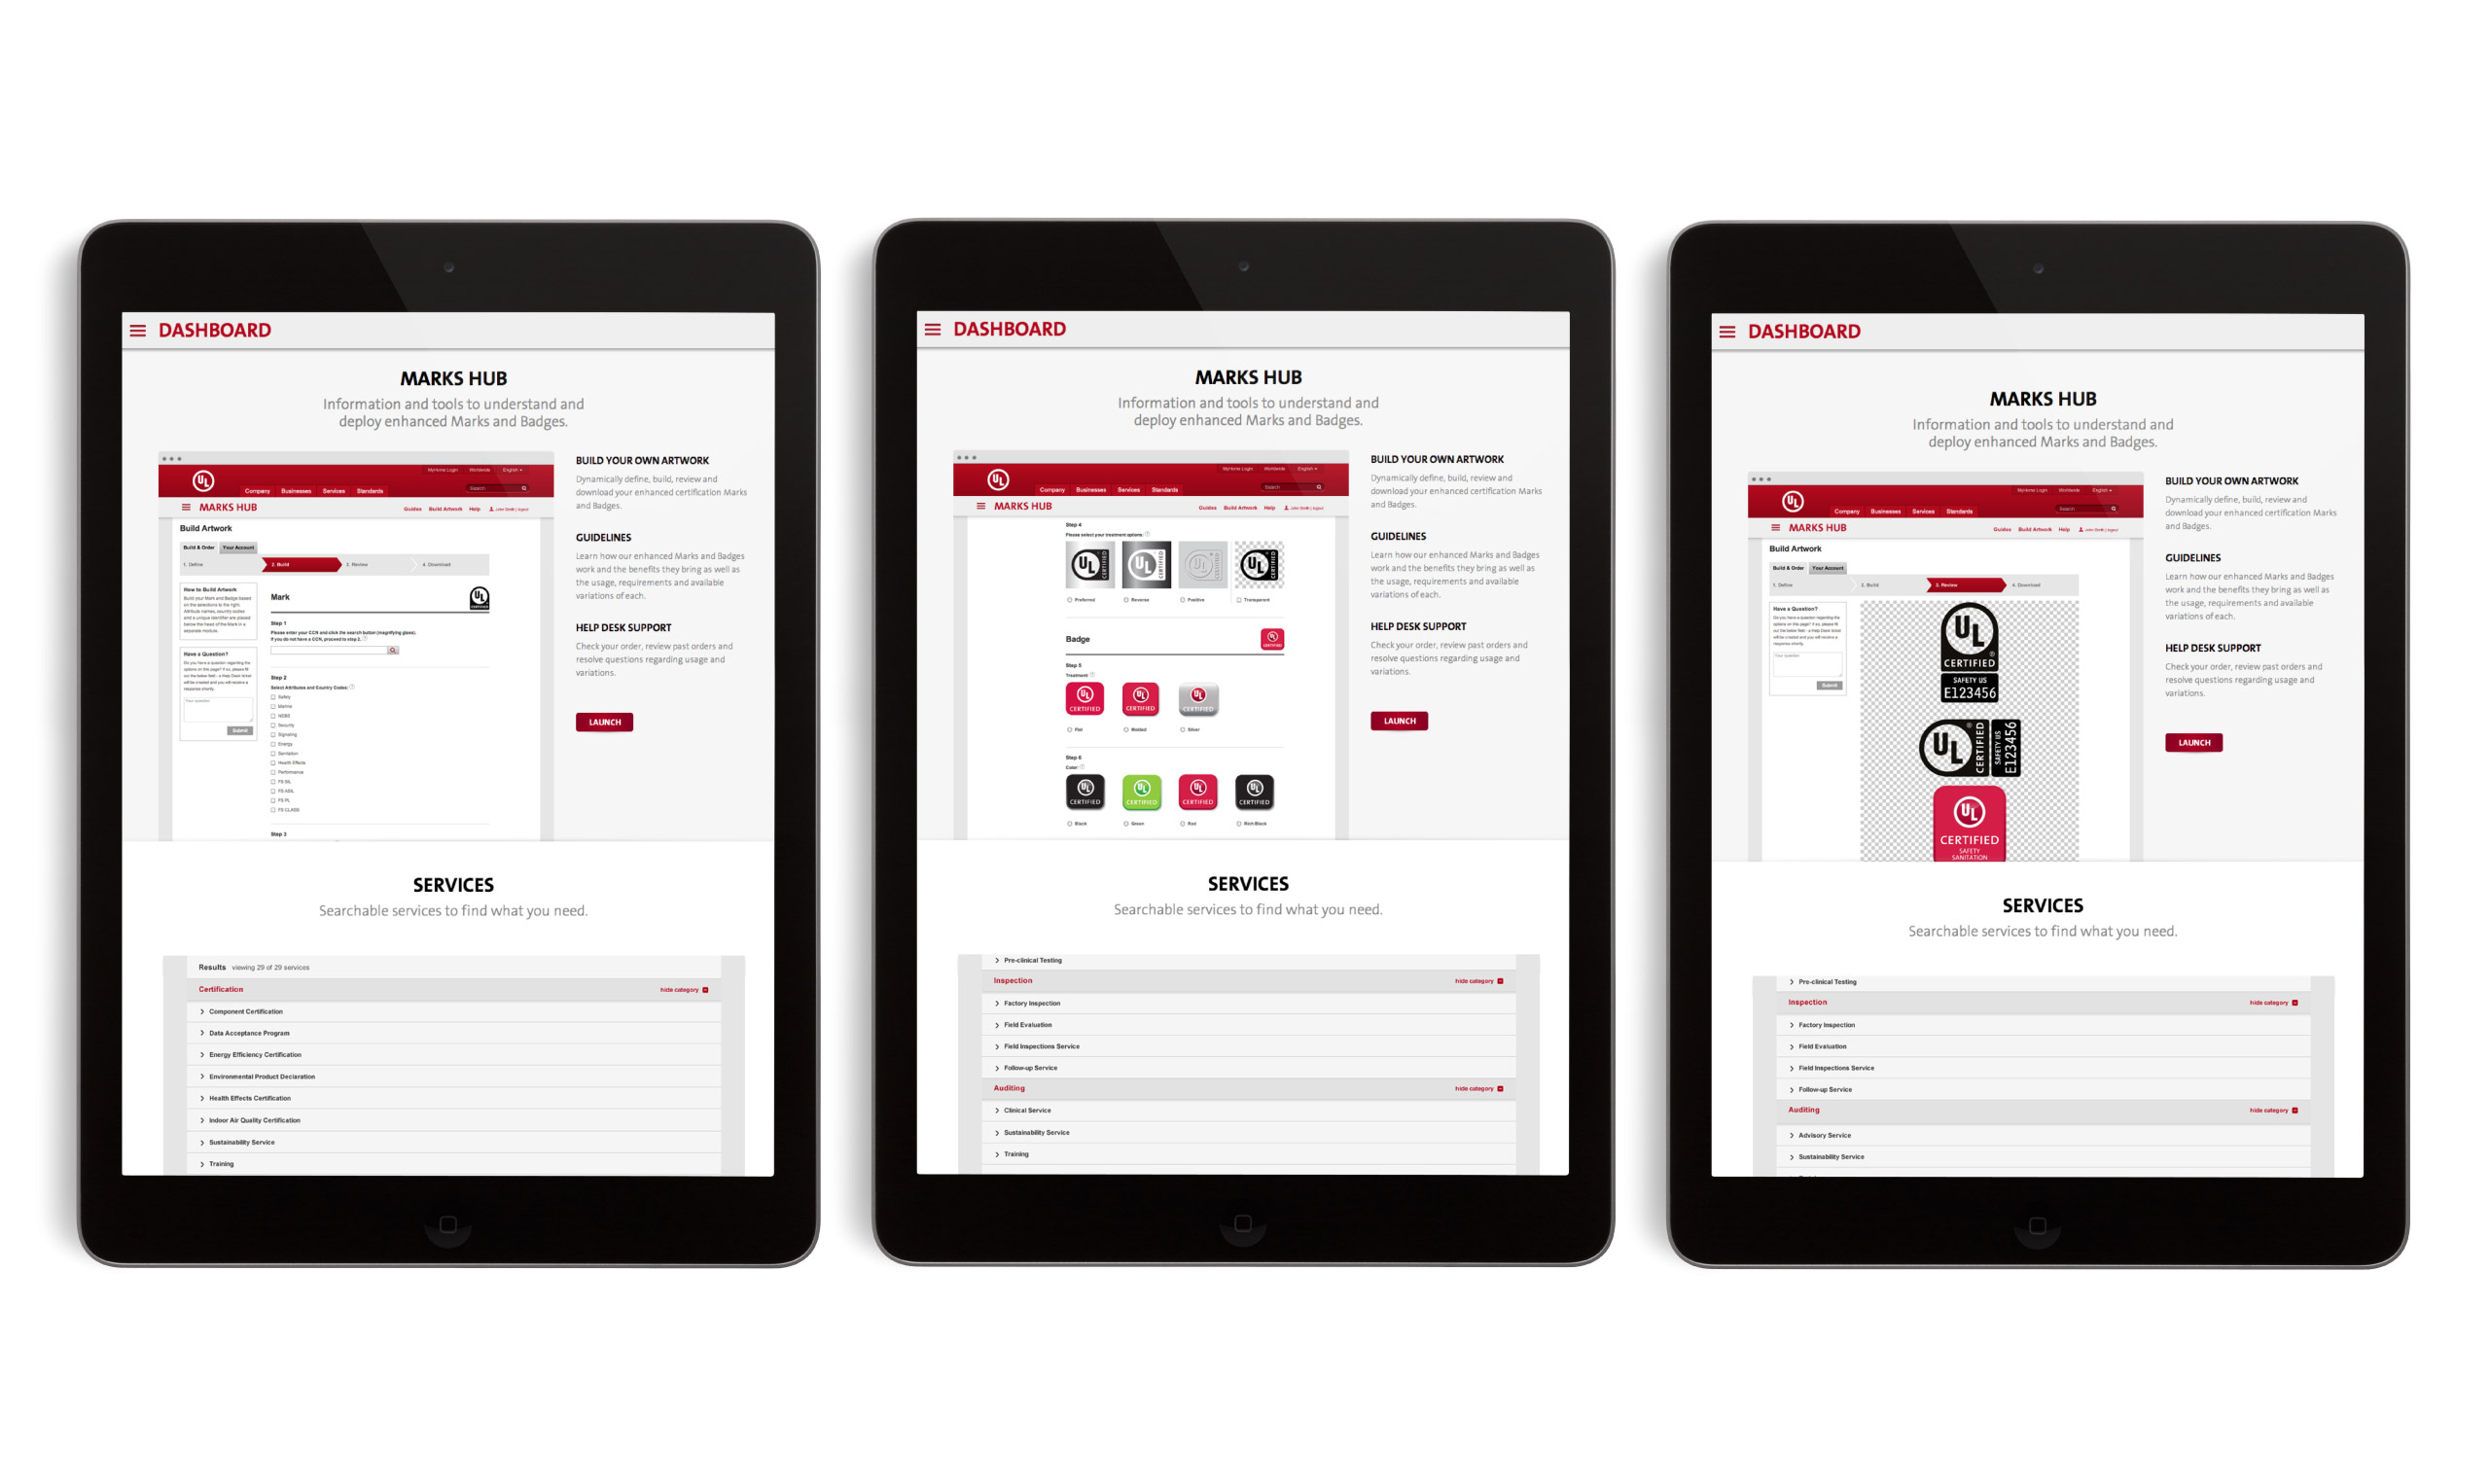
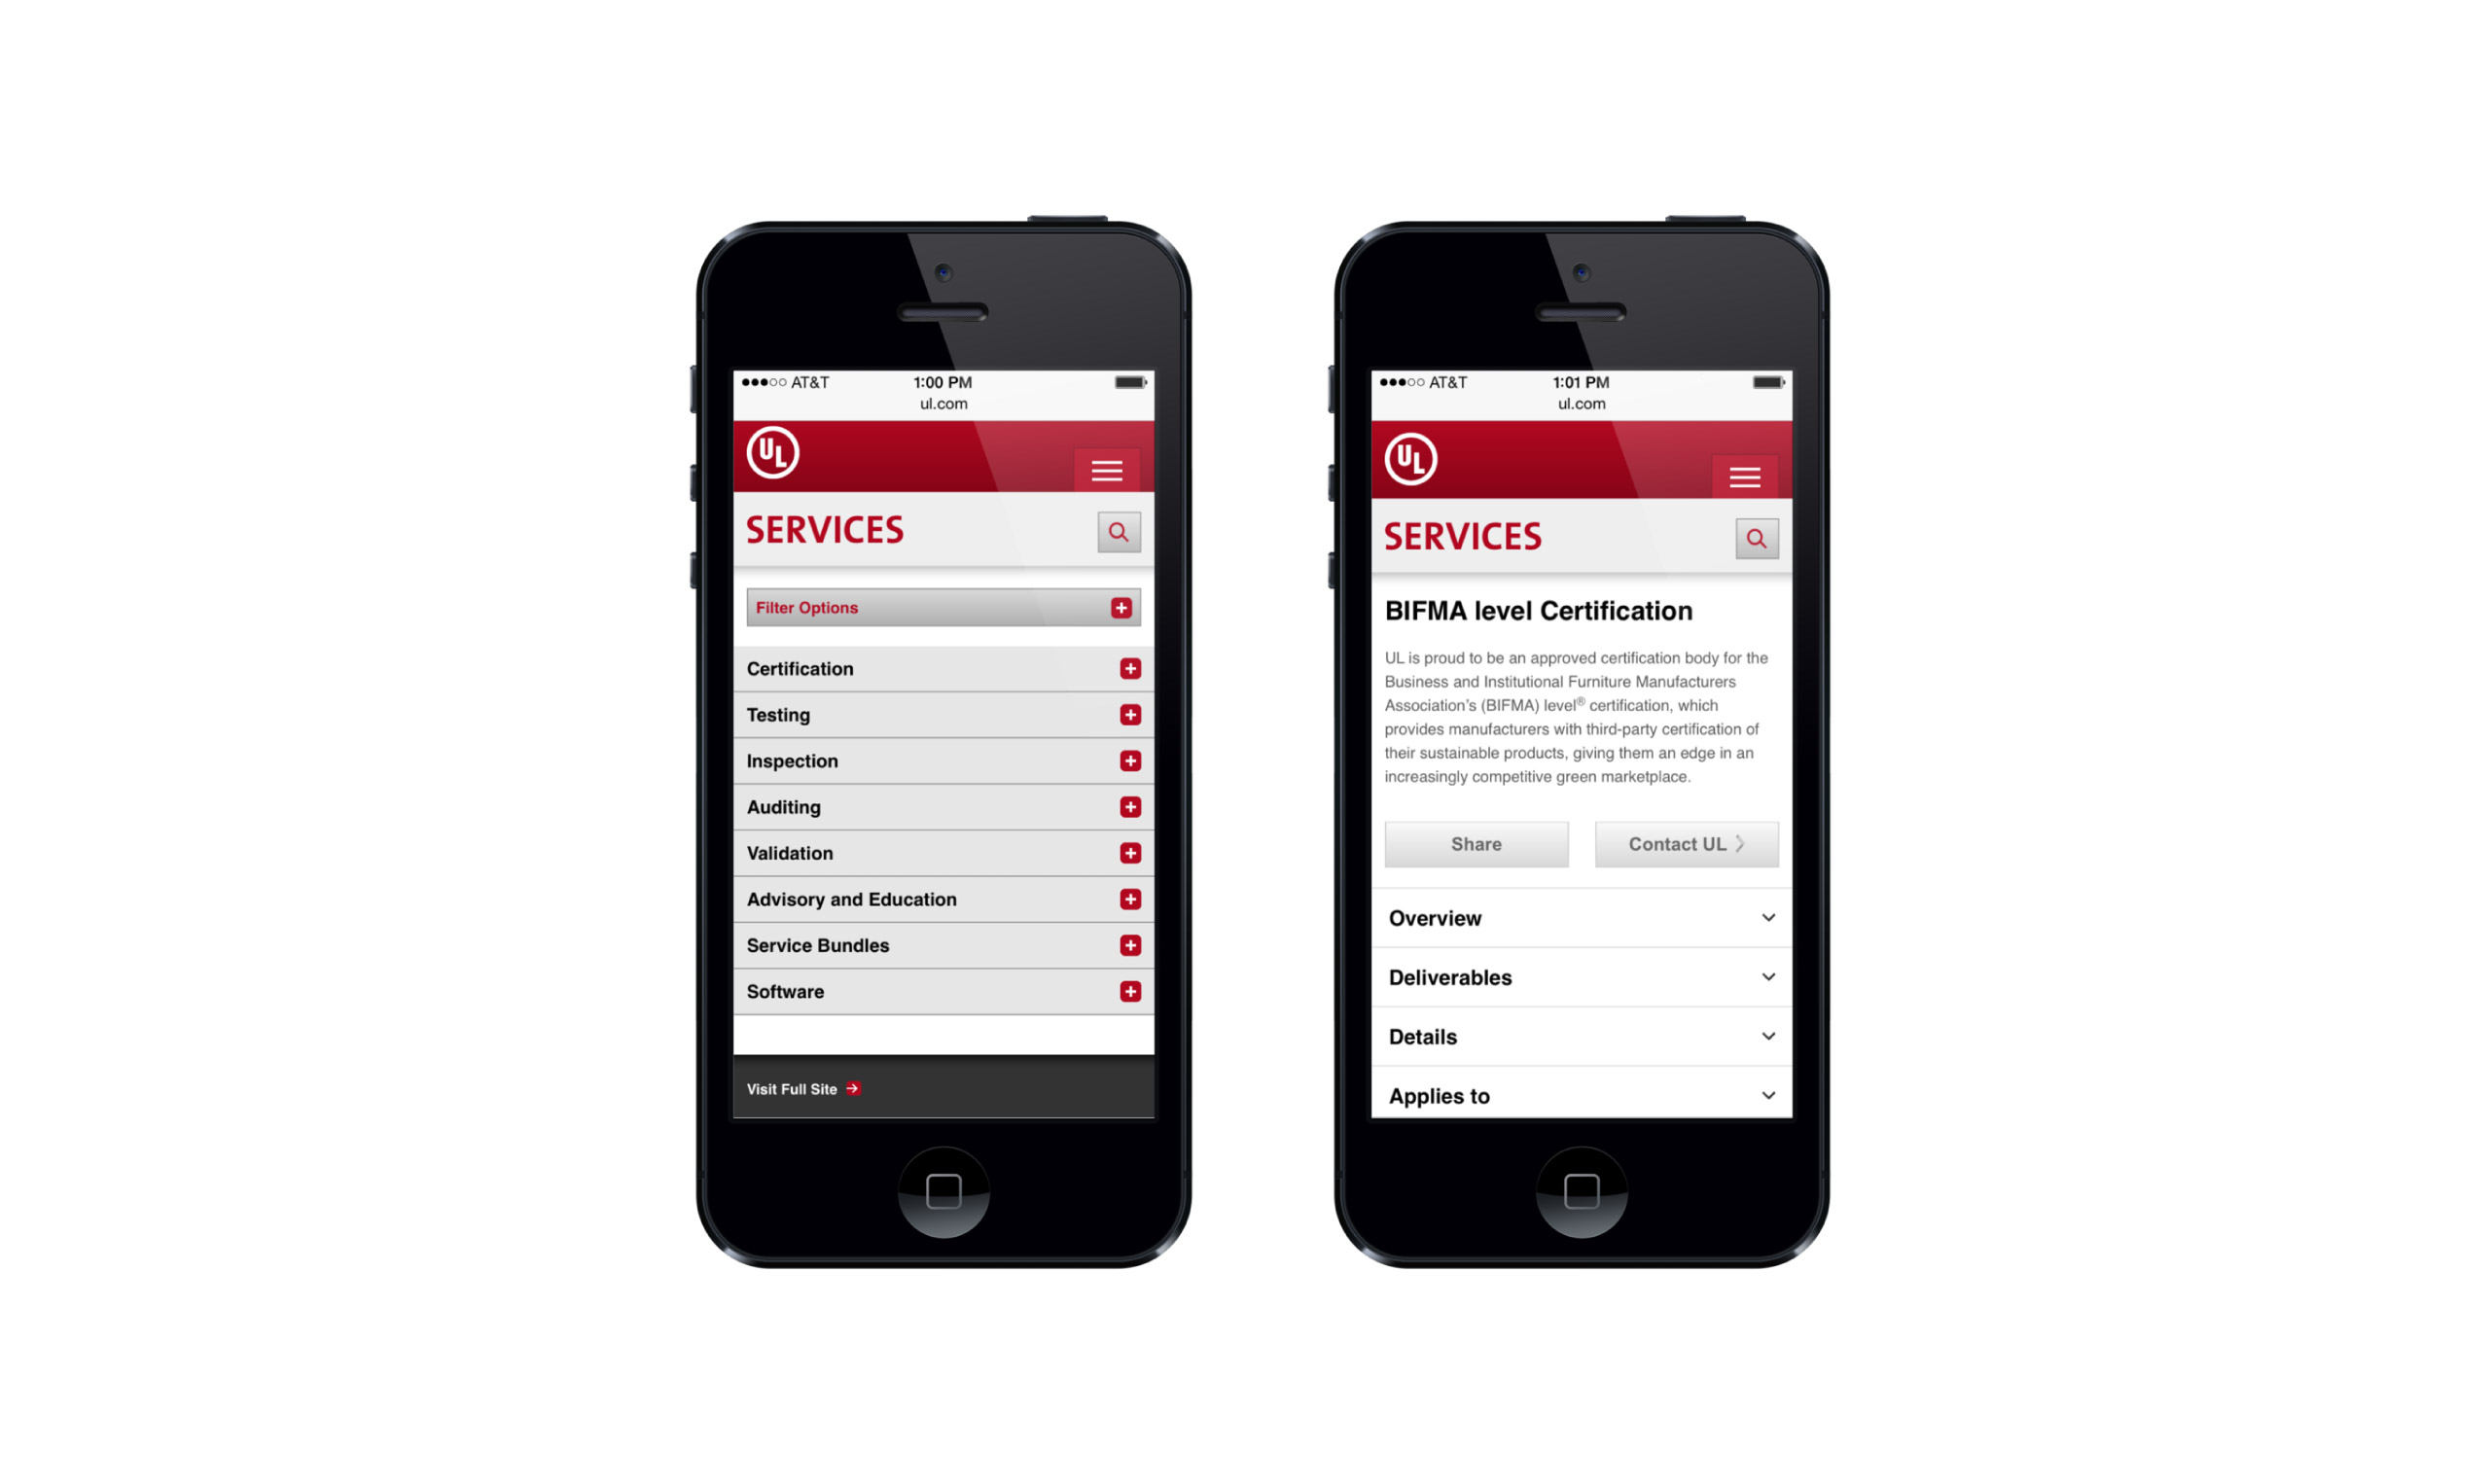
Central to that plan was the harnessing of key areas of site functionality or tools where users were deeply engaged or had the potential to create meaningful value. A suite of initial tools was identified and the process to build, design, package and launch was undertaken. The first four tools in the suite were launched internally and externally in 2013, and new ones are due to be added this year and in frequent development cycles thereafter.
In addition to launching the tools as stand-alone assets, we intersected them into major content areas of the site to create context-sensitive intersections between content and functionality.
Results
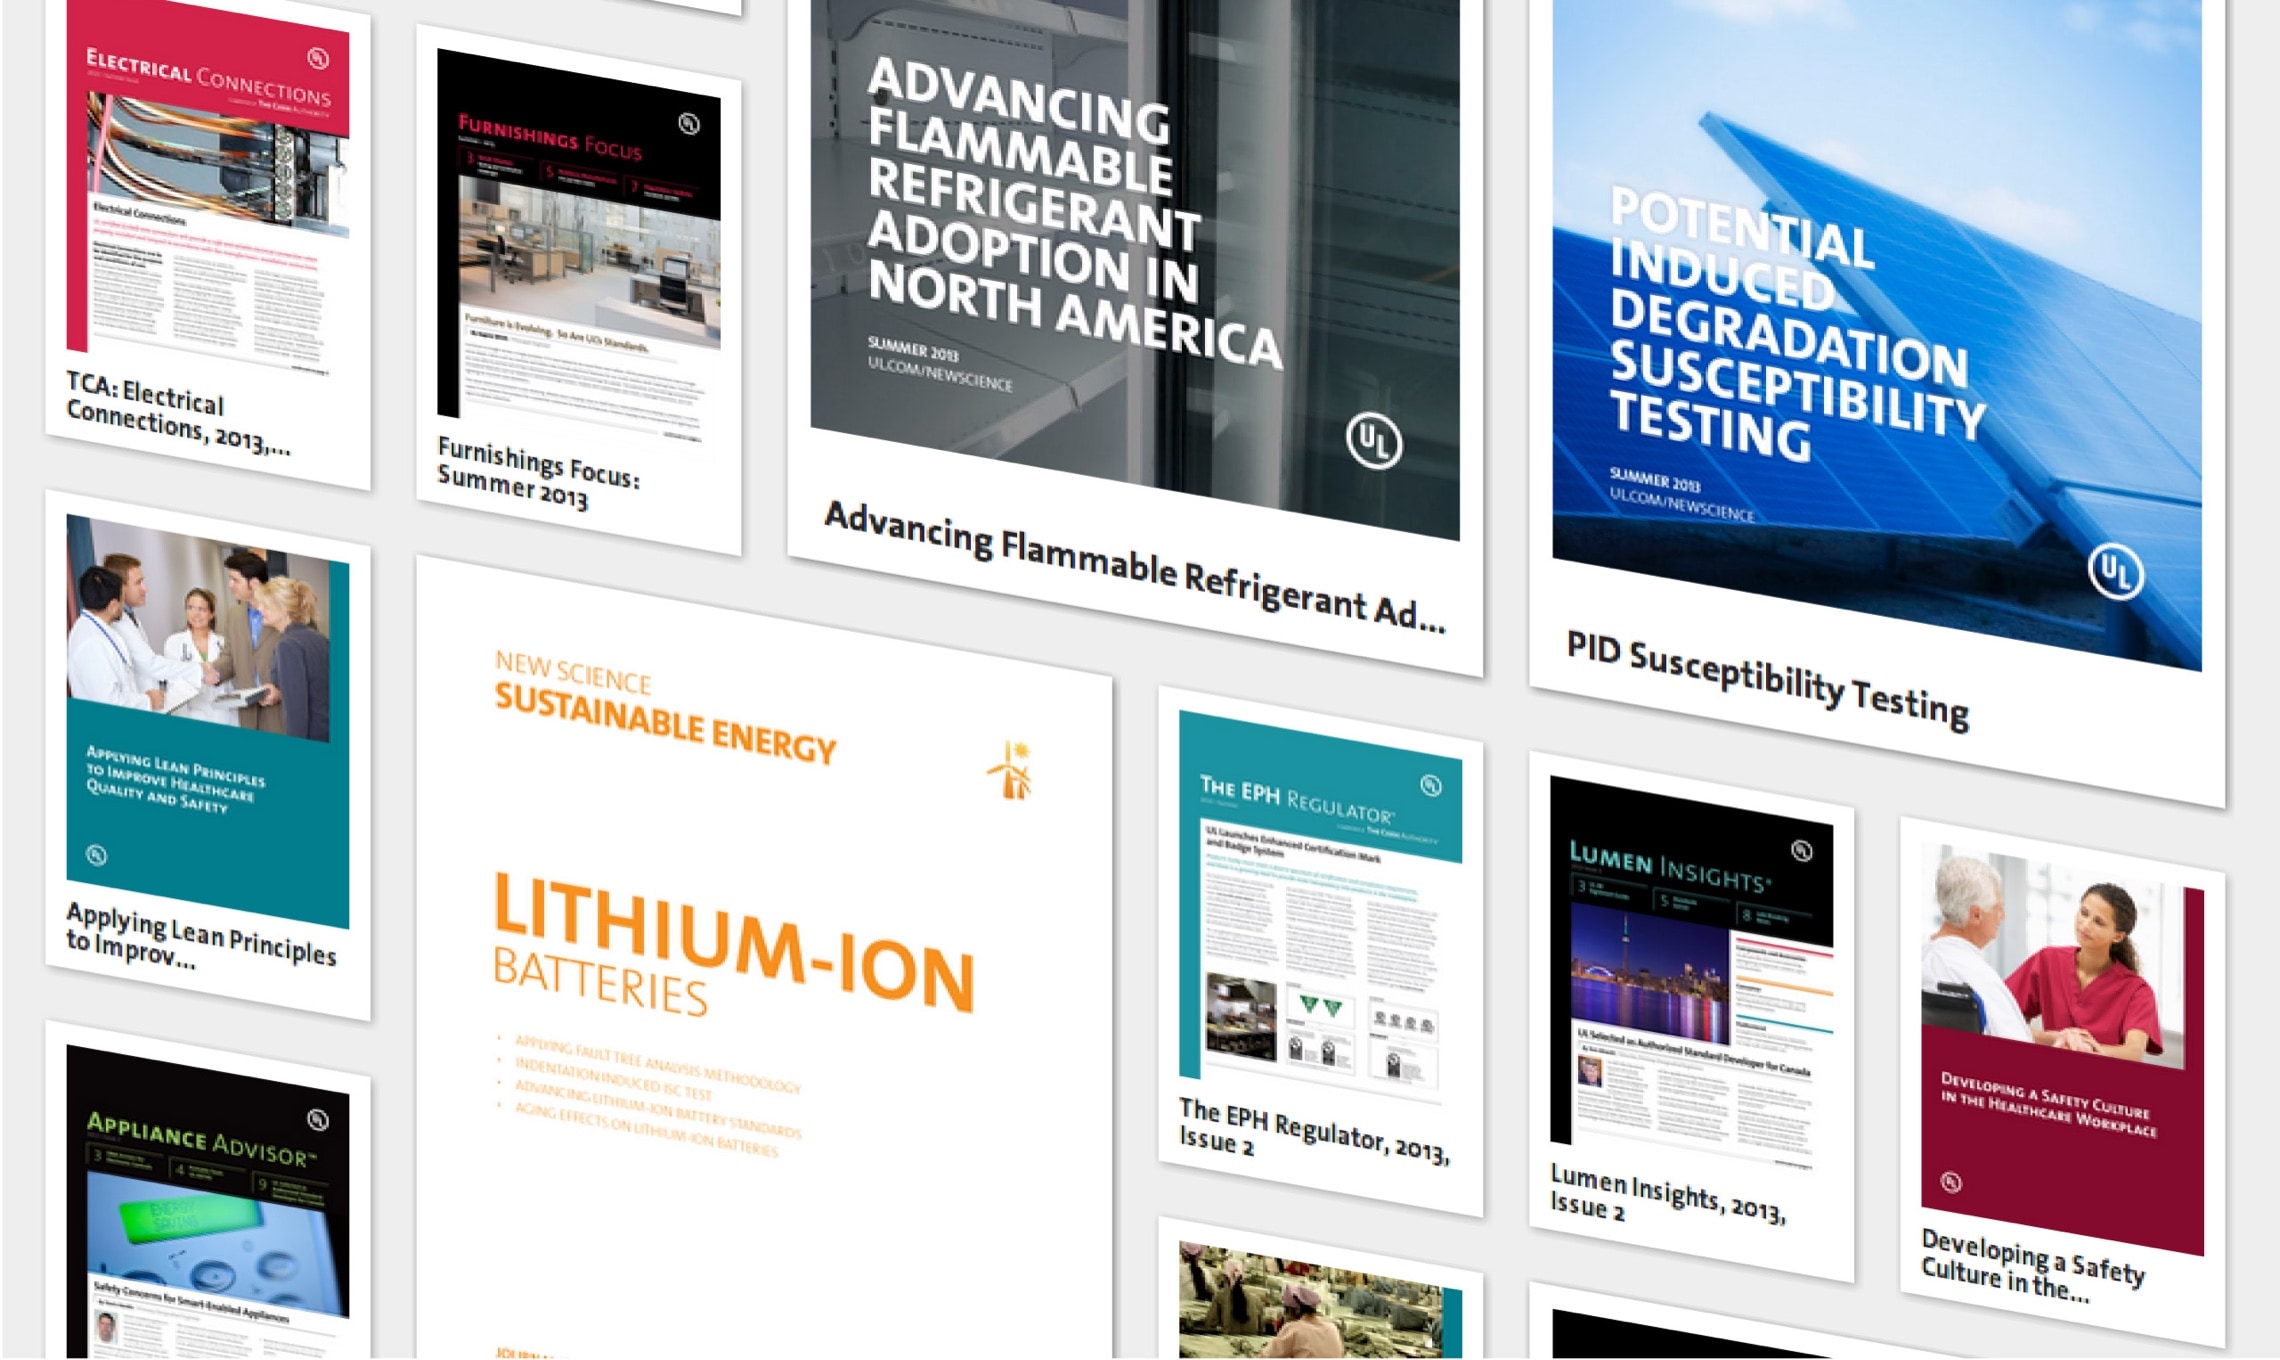
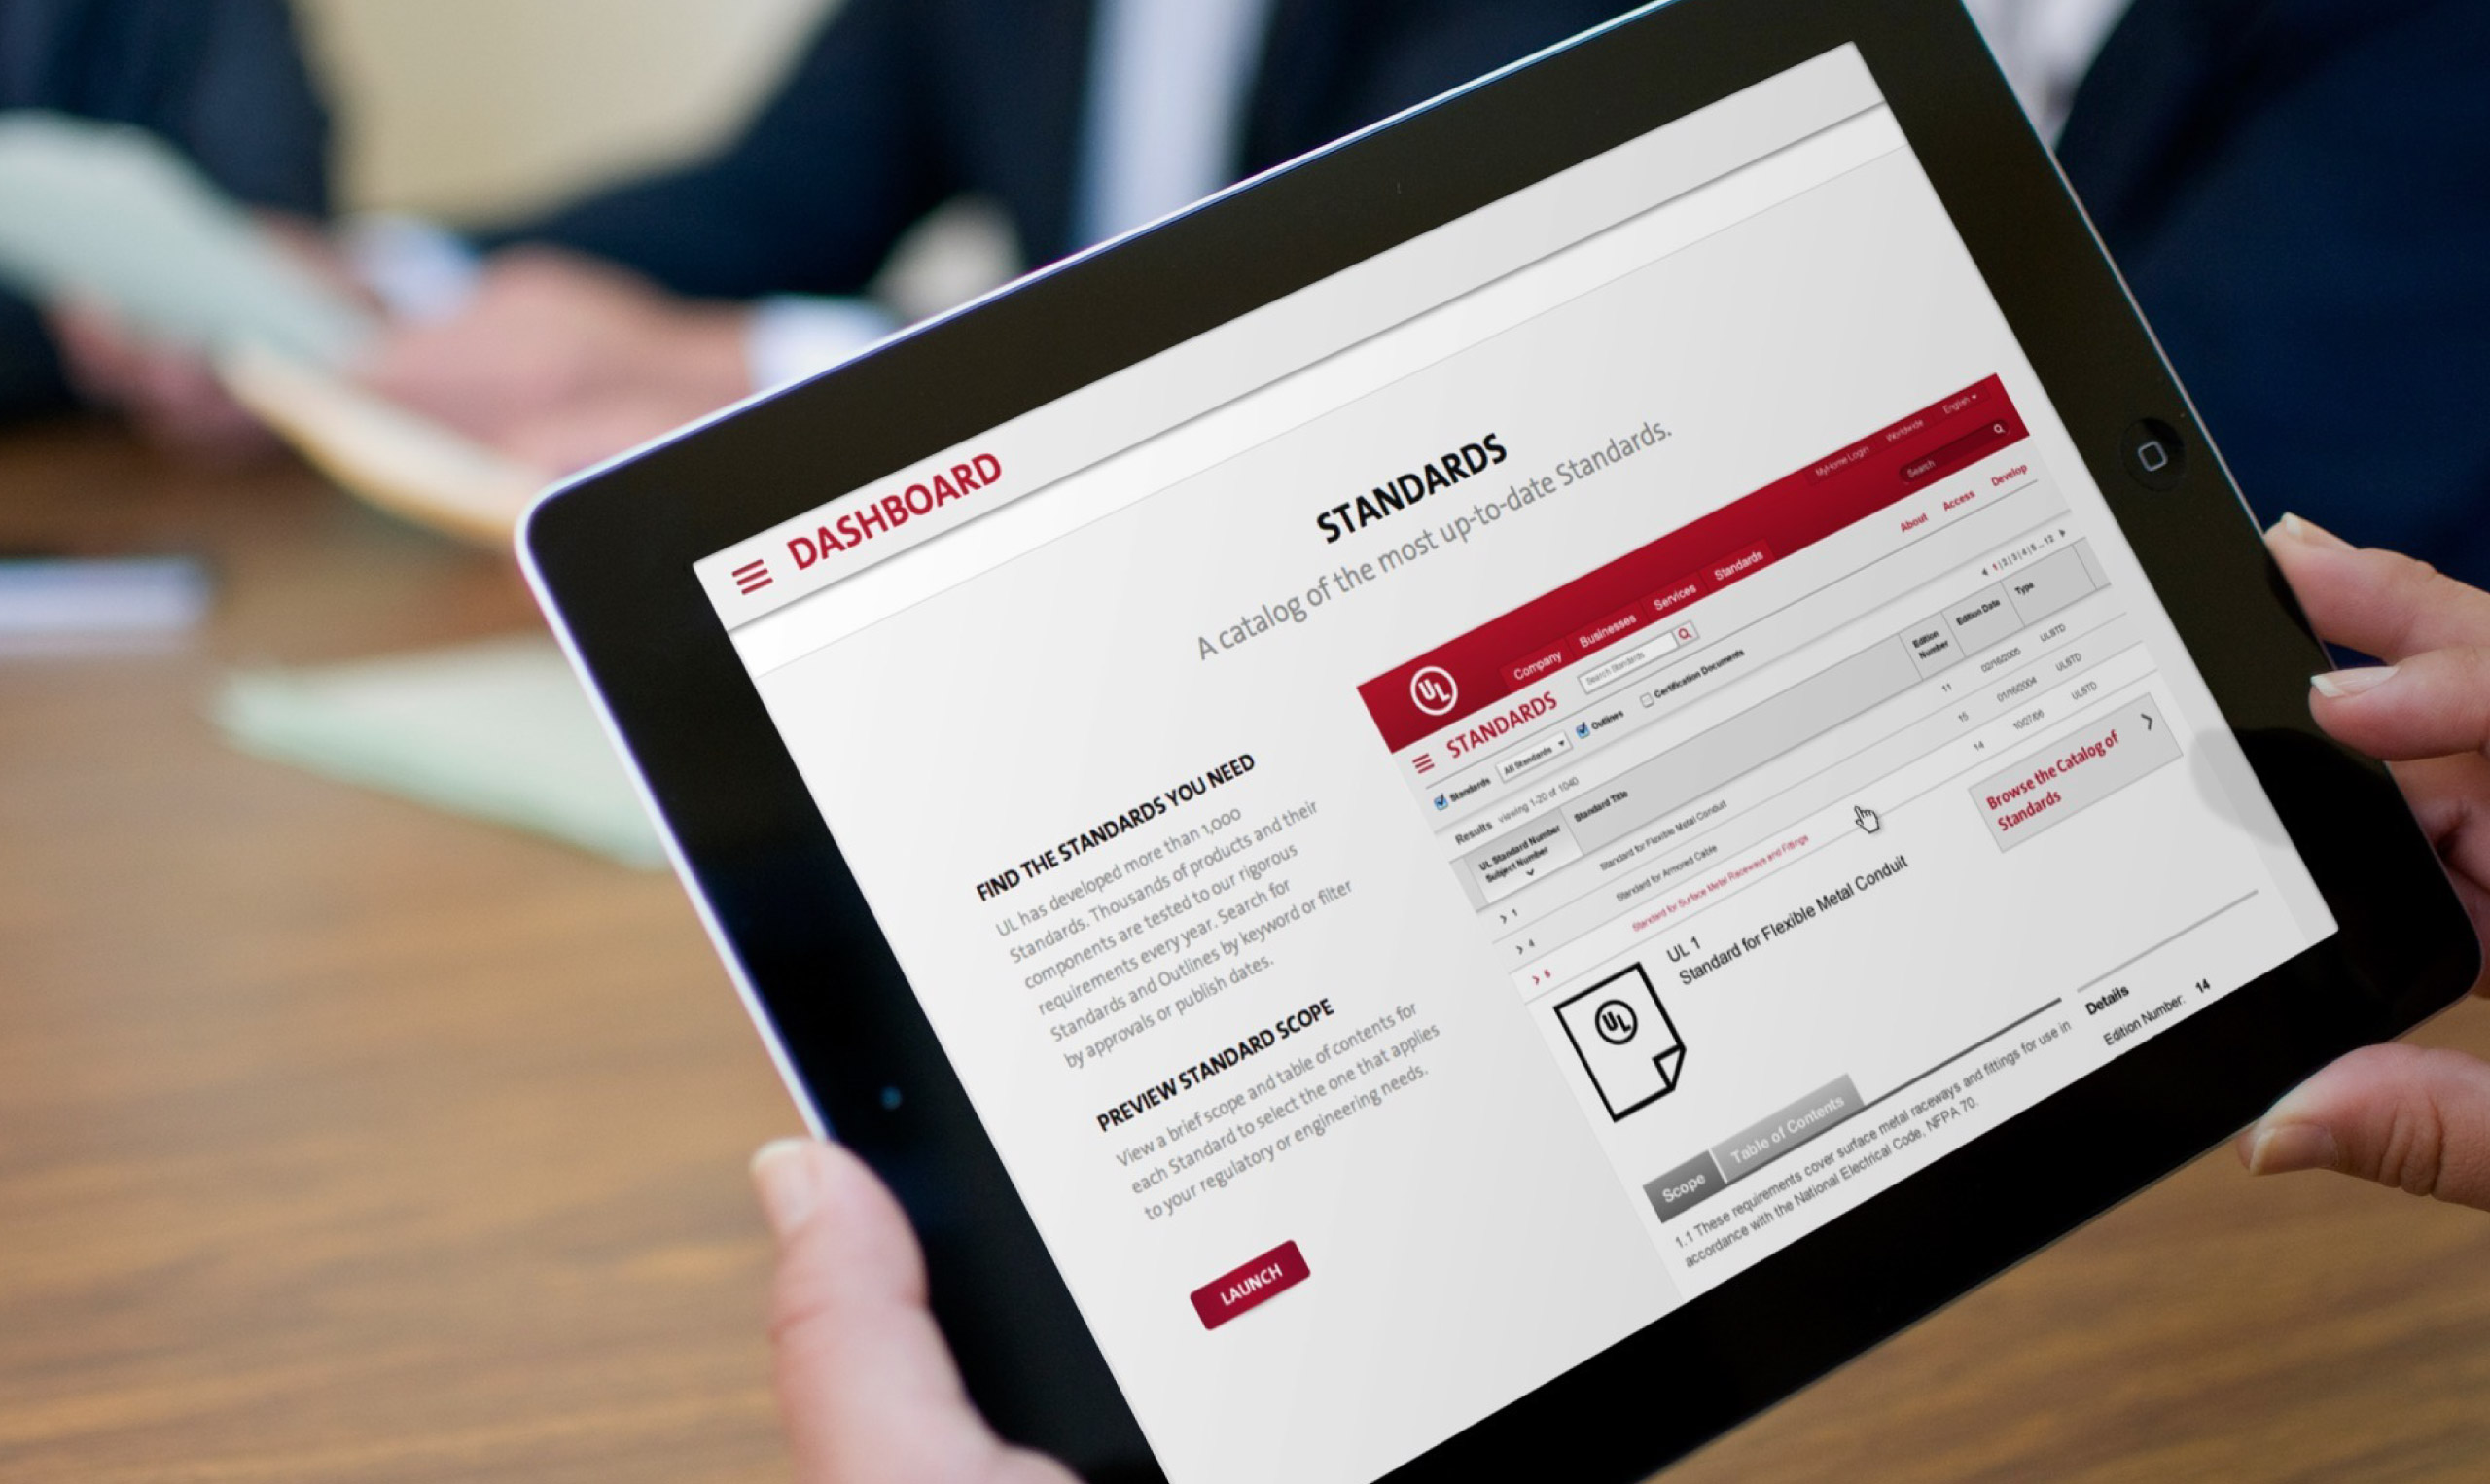
Since the launch in 2013, the UL dashboard tool has consistently ranked among the top 10 site destinations, providing customers and prospects easy access to key information. In addition to increased traffic and engagement, the dashboard tools have provided enhanced usability and ease with which to sort, find and compare complex data, reports and offerings.
Client
UL